Detecting strain with a fiber optic cable on the seafloor offshore Mount Etna, Southern Italy
Oceans cover more than 70 percent of the Earth's surface making it difficult and costly to deploy modern seismological instruments here. The rapidly expanding global network of submarine telecom cables offers tremendous possibilities for seismological monitoring using laser light. Recent pioneer studies have demonstrated earthquake detection using lasers in onland and submarine fiber optic cables. However, permanent strain at the seafloor has never before been measured directly as it happens. With this aim, we deployed a dedicated 6-km-long fiber optic strain cable, offshore Catania Sicily, in 2000 m water depth, and connected it to a 29-km long electro-optical cable for science use. We report here that deformation of the cable equivalent to a total elongation of 2.5 cm was observed over a 21-month period (from Oct. 2020 to Jul. 2022). Brillouin laser reflectometry observations over the first 10 months indicate significant strain (+25 to +40 microstrain) at two locations where the cable crosses an active strike-slip fault on the seafloor, with most of the change occurring between 19 and 21 Nov. 2020. The cause of the strain could be fault slip or seabottom currents. During the following 11 months, the strain amplitude increased to +45 to +55 microstrain, affecting a longer portion of the cable up to 500 m to either side of the first fault crossing. A sandbag experiment performed on the distal portion of the cable (3.2–6.0 km) starting Sept. 2021 demonstrates how the fiber optic cable deforms in response to an applied load and how the deformation signal partially dissipates over time due to the elastic properties of the cable. These preliminary results are highly encouraging for the use of BOTDR (Brillouin Optical Time Domain Reflectometry) laser reflectometry as a technique to detect strain at the seafloor in near real time and to monitor the structural health of submarine cables.
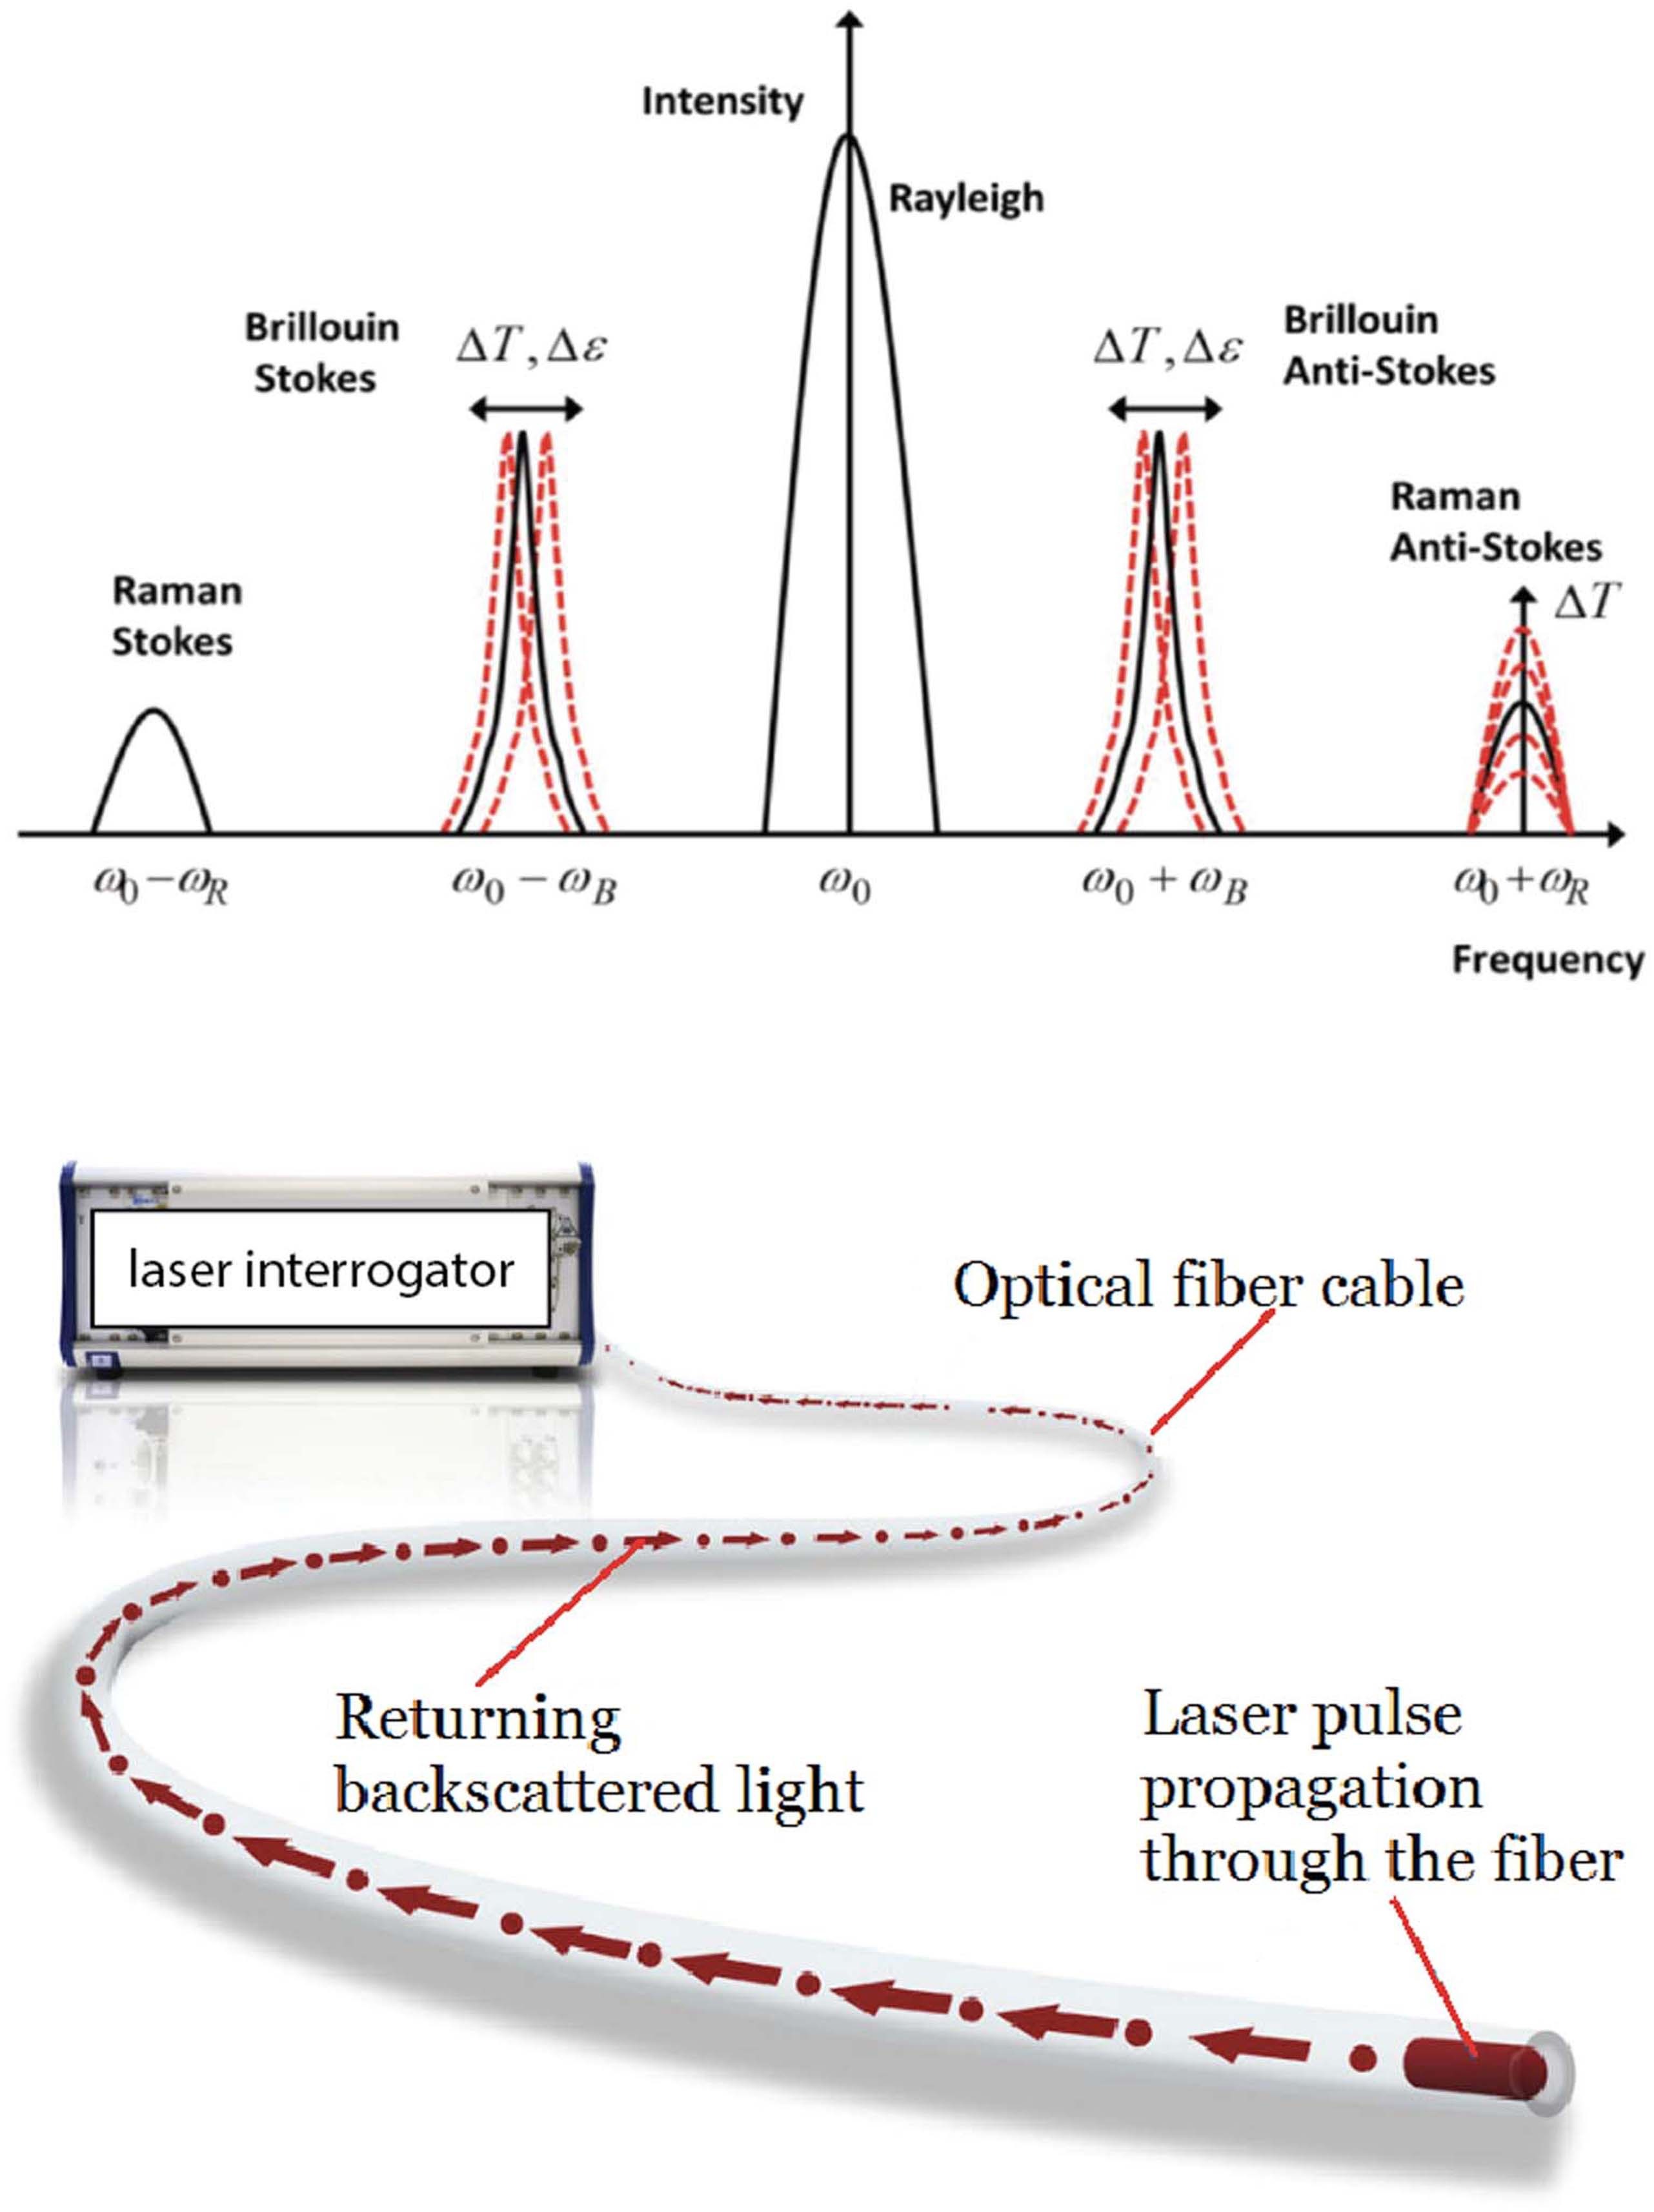
Figure S1. Top - the principles of laser reflectometry and the different diffraction peaks (Rayleigh, Brillouin and Raman). Bottom - the principles of laser reflectometry showing how laser light ...
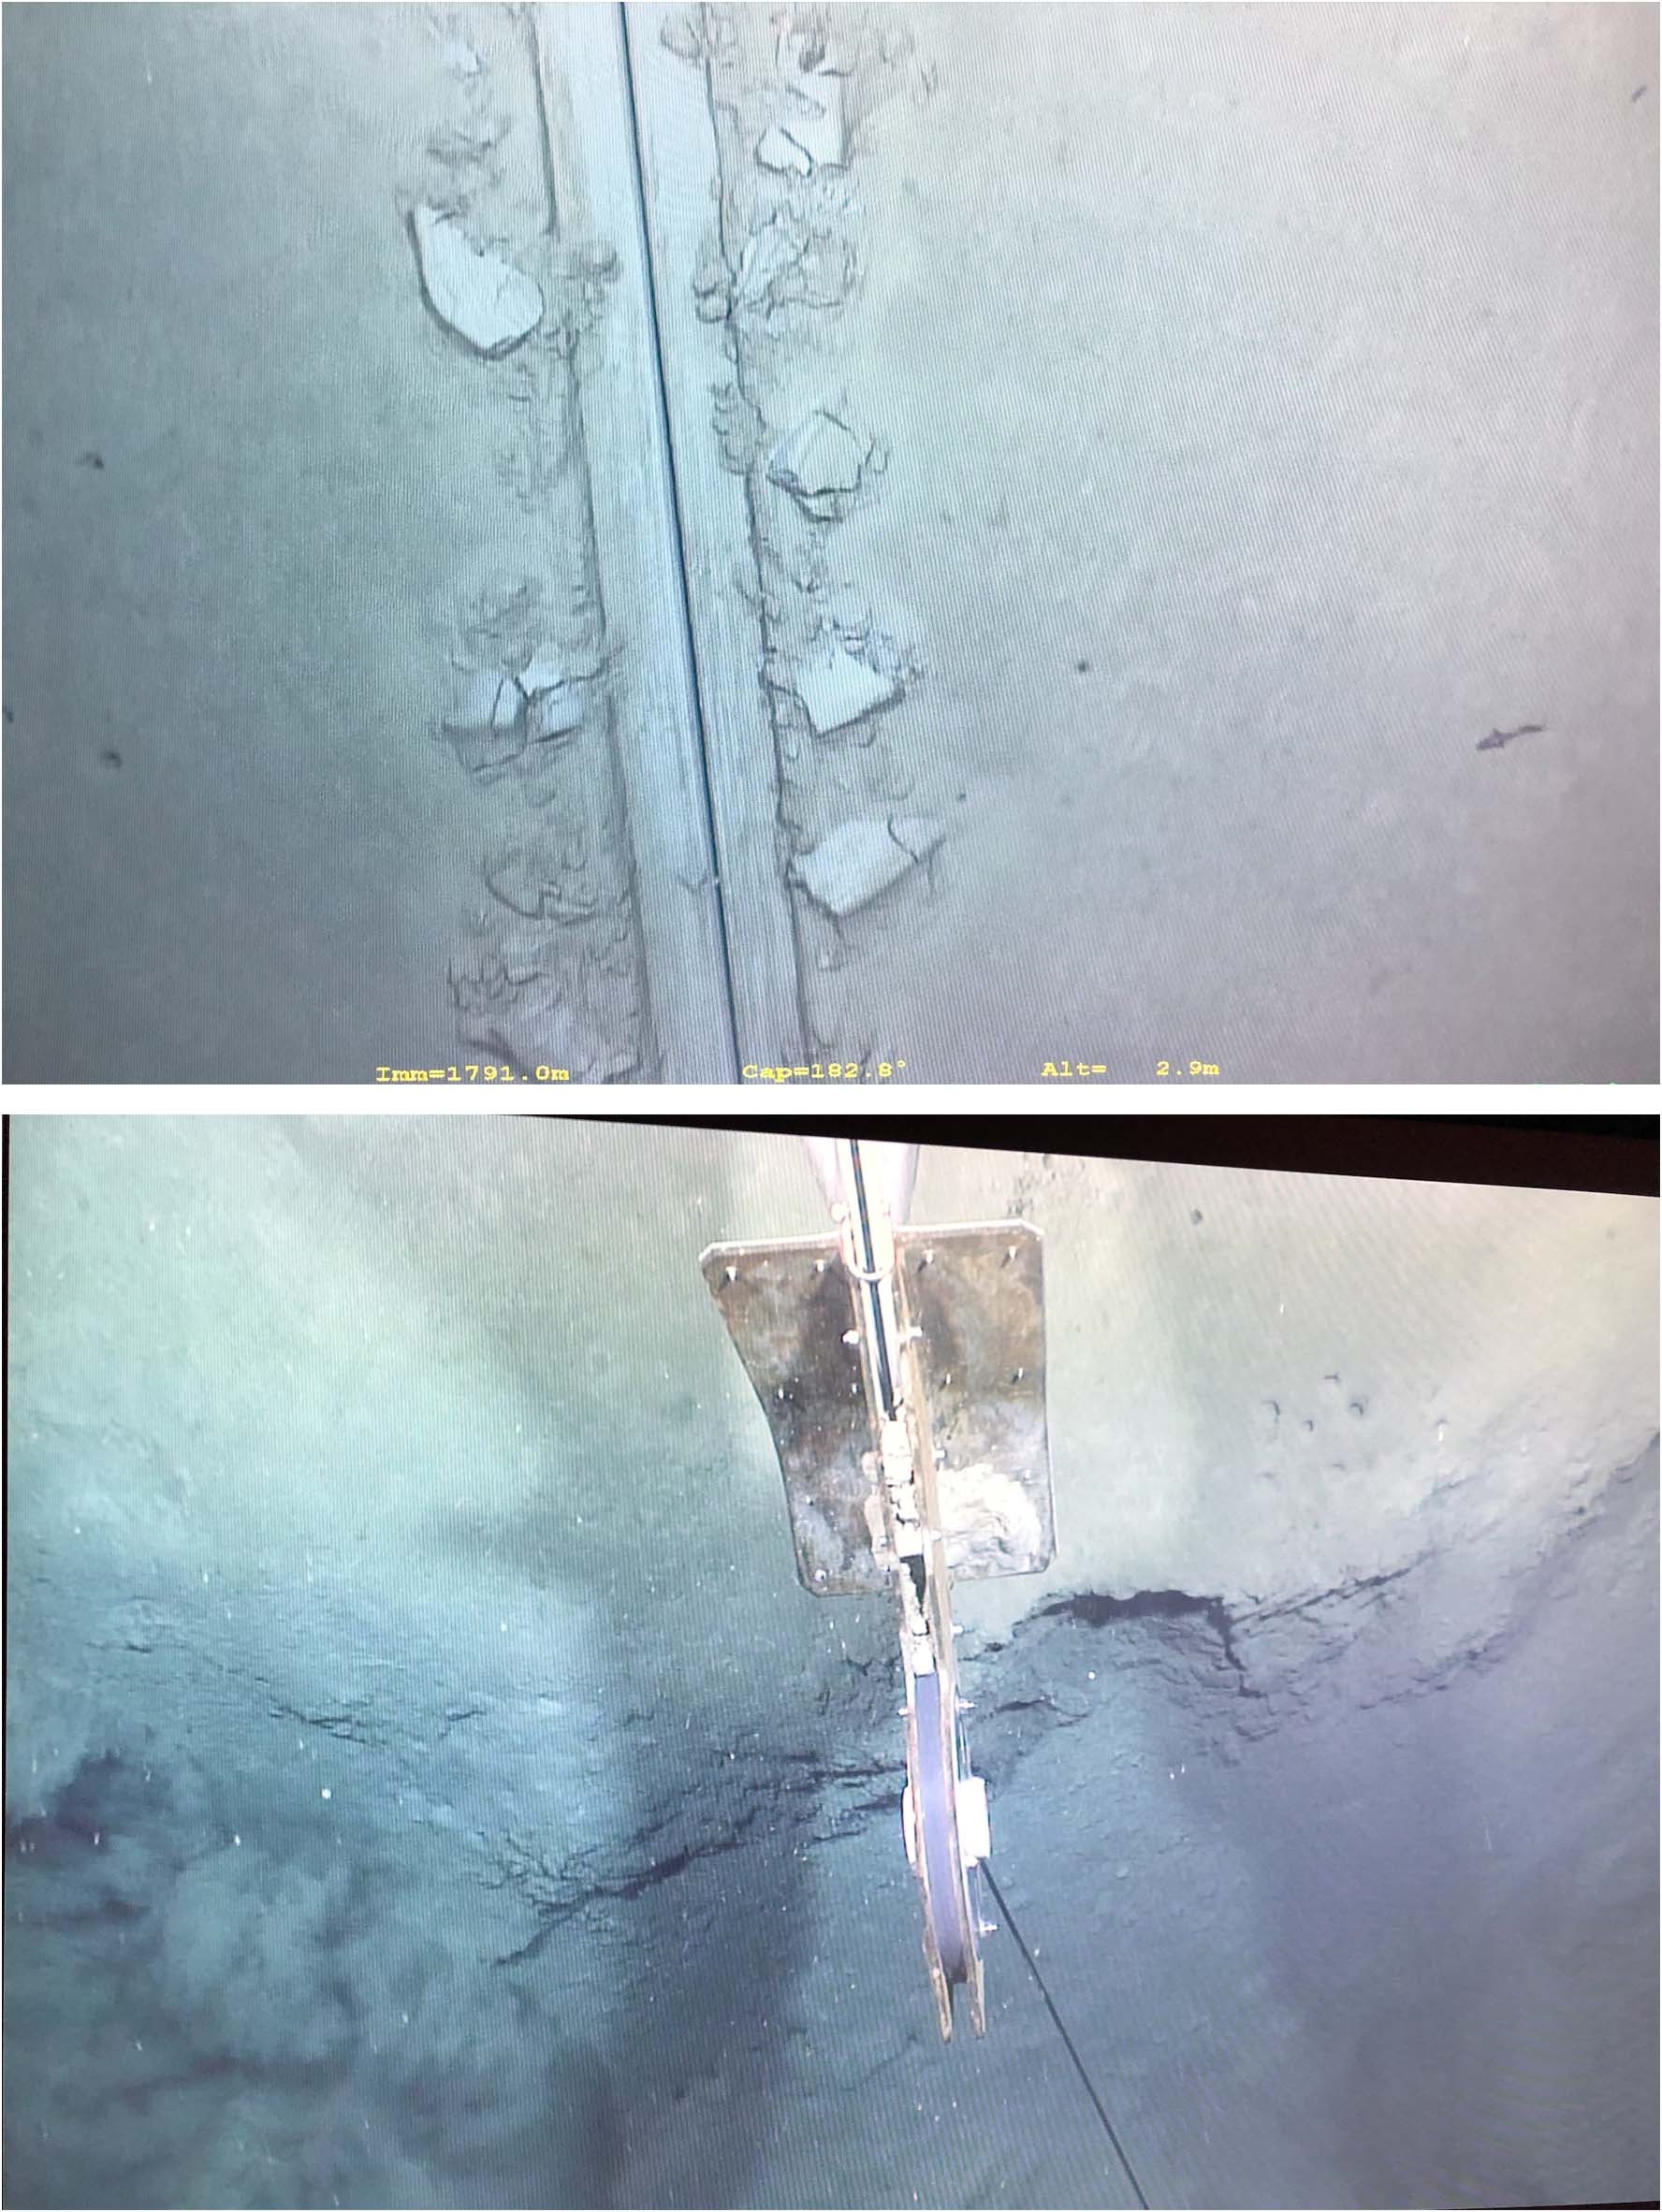
Figure S2. Top - the plow track after successful burial of the cable at the bottom of a 20 cm deep groove (mini-trench) in the soft mud. Note the small fish at right. Bottom - the plow going over ...
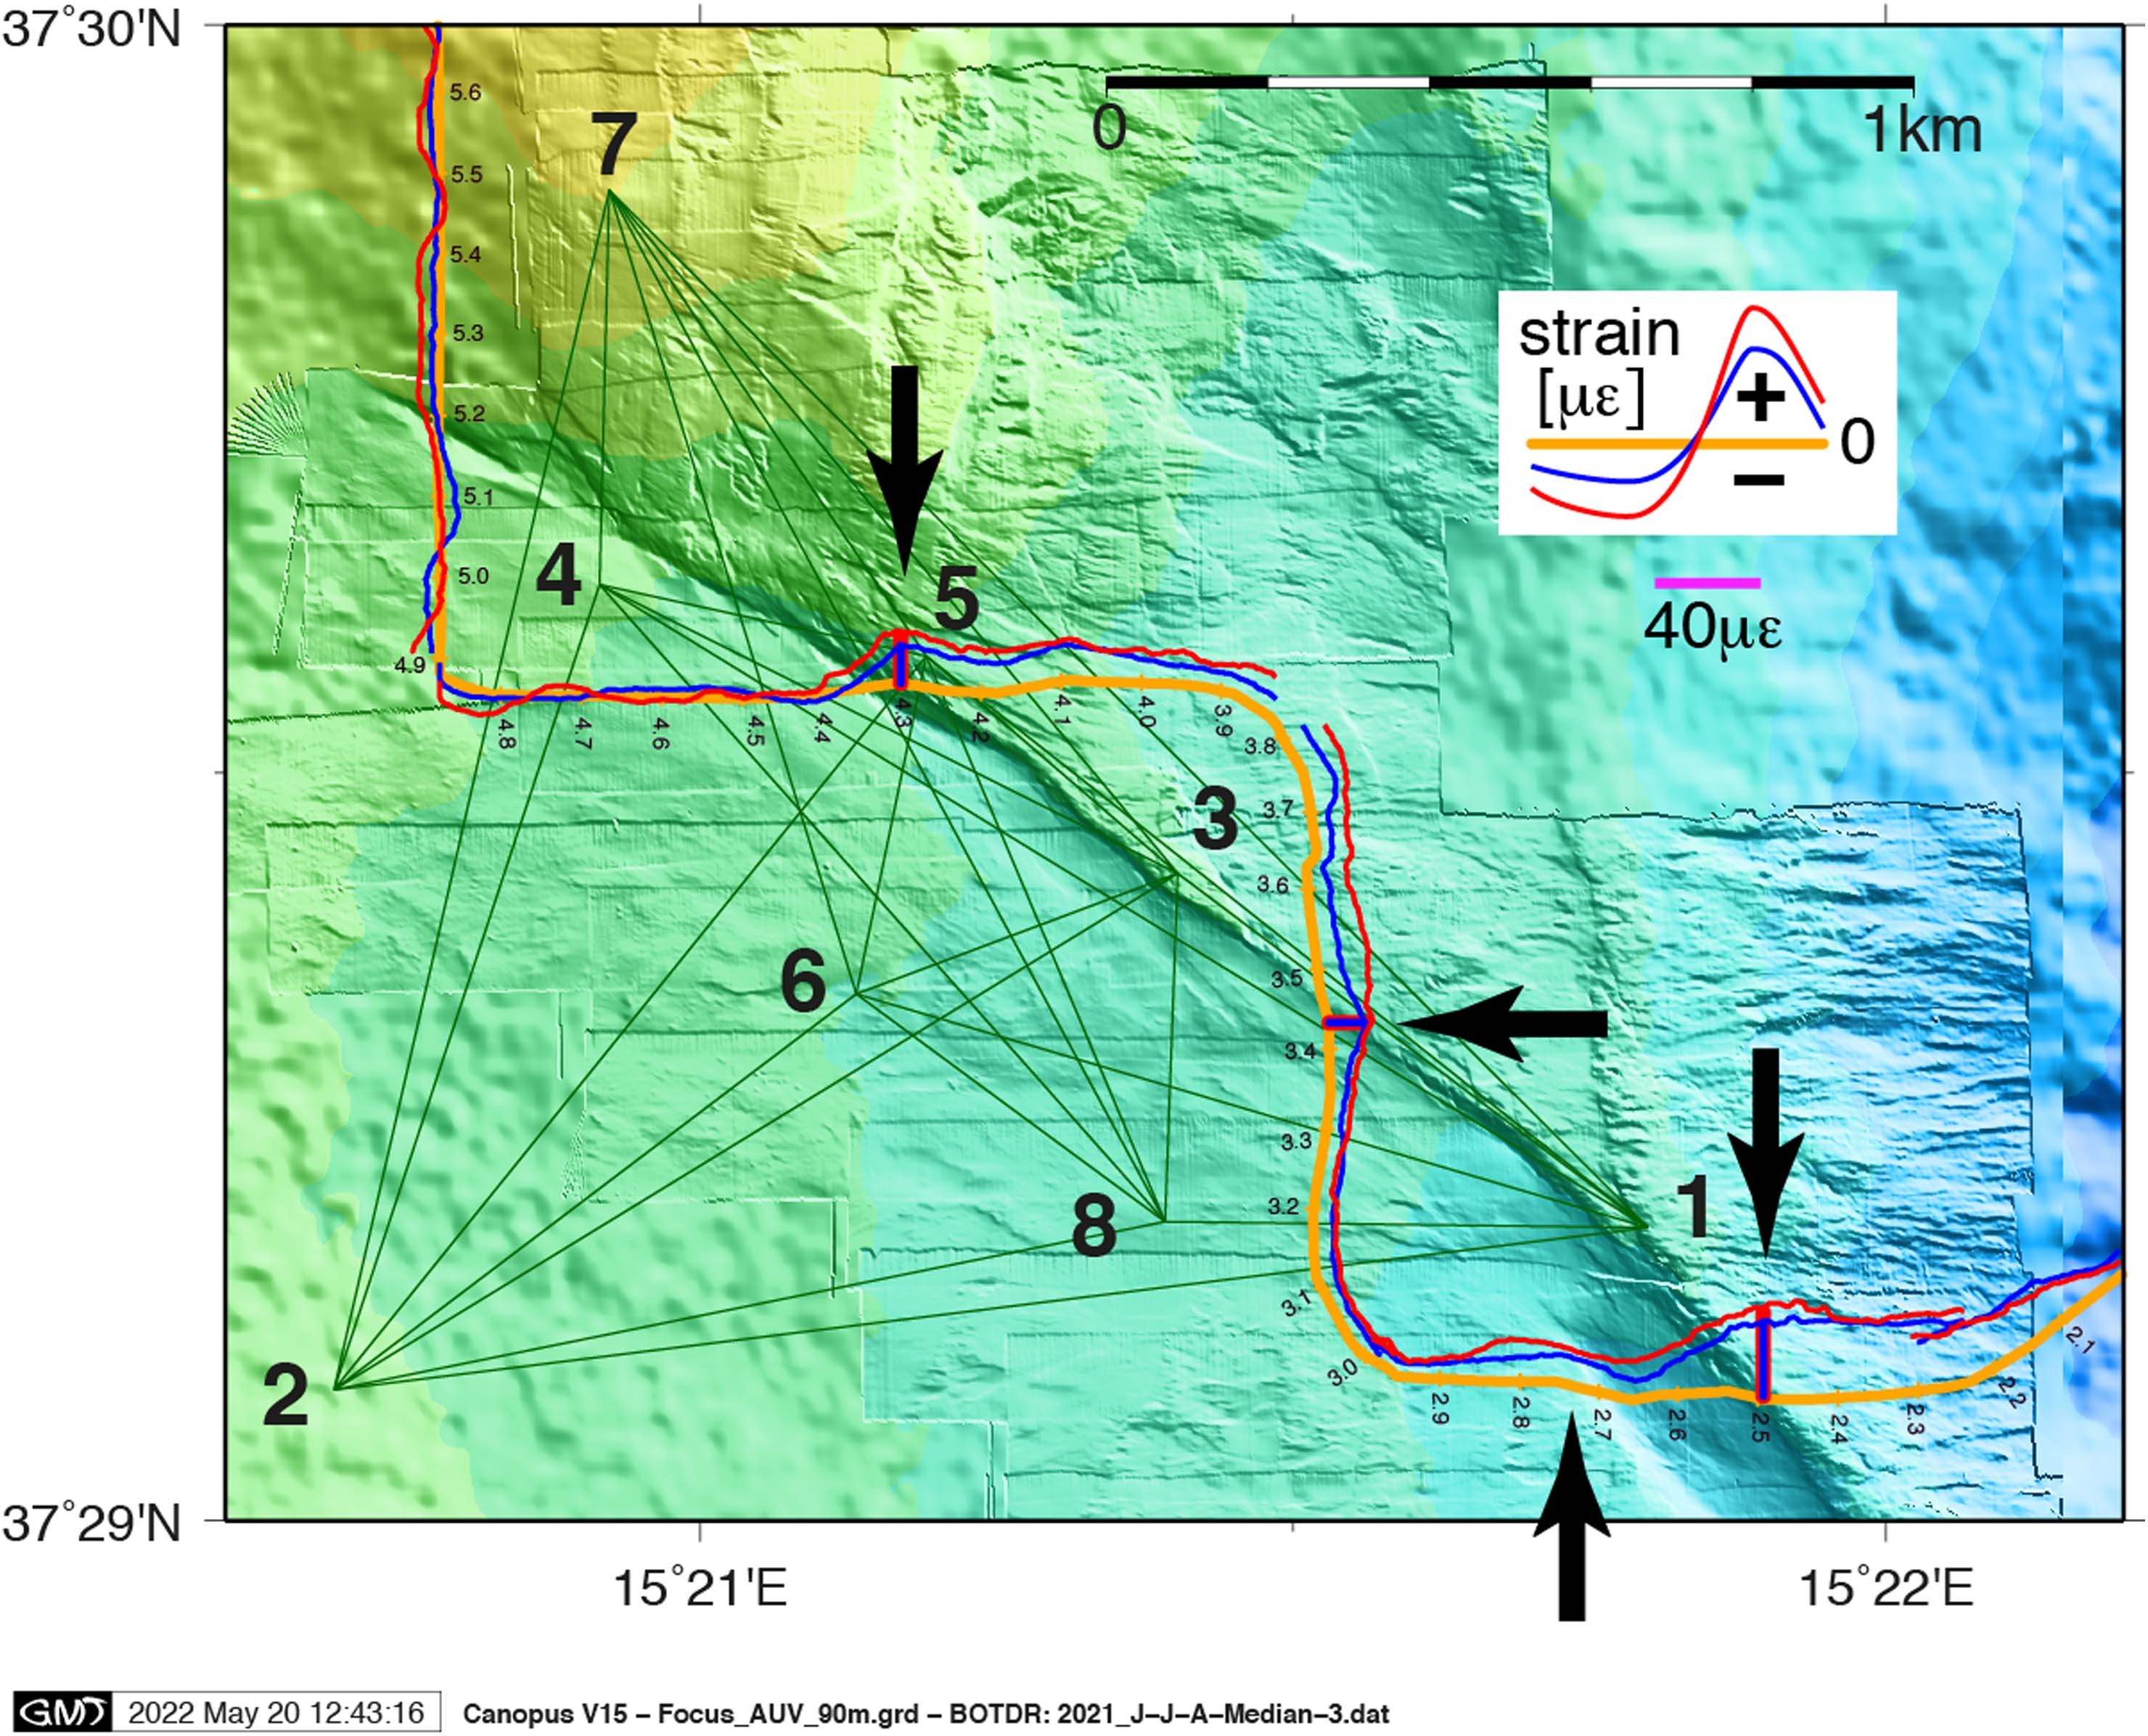
Figure S3. The BOTDR strain measurements from 28 Aug. 2021 (with respect to the 28 Oct. 2020 baseline) projected onto the track of the 6-km-long fiber optic strain cable, with the micro-bathymetry ...
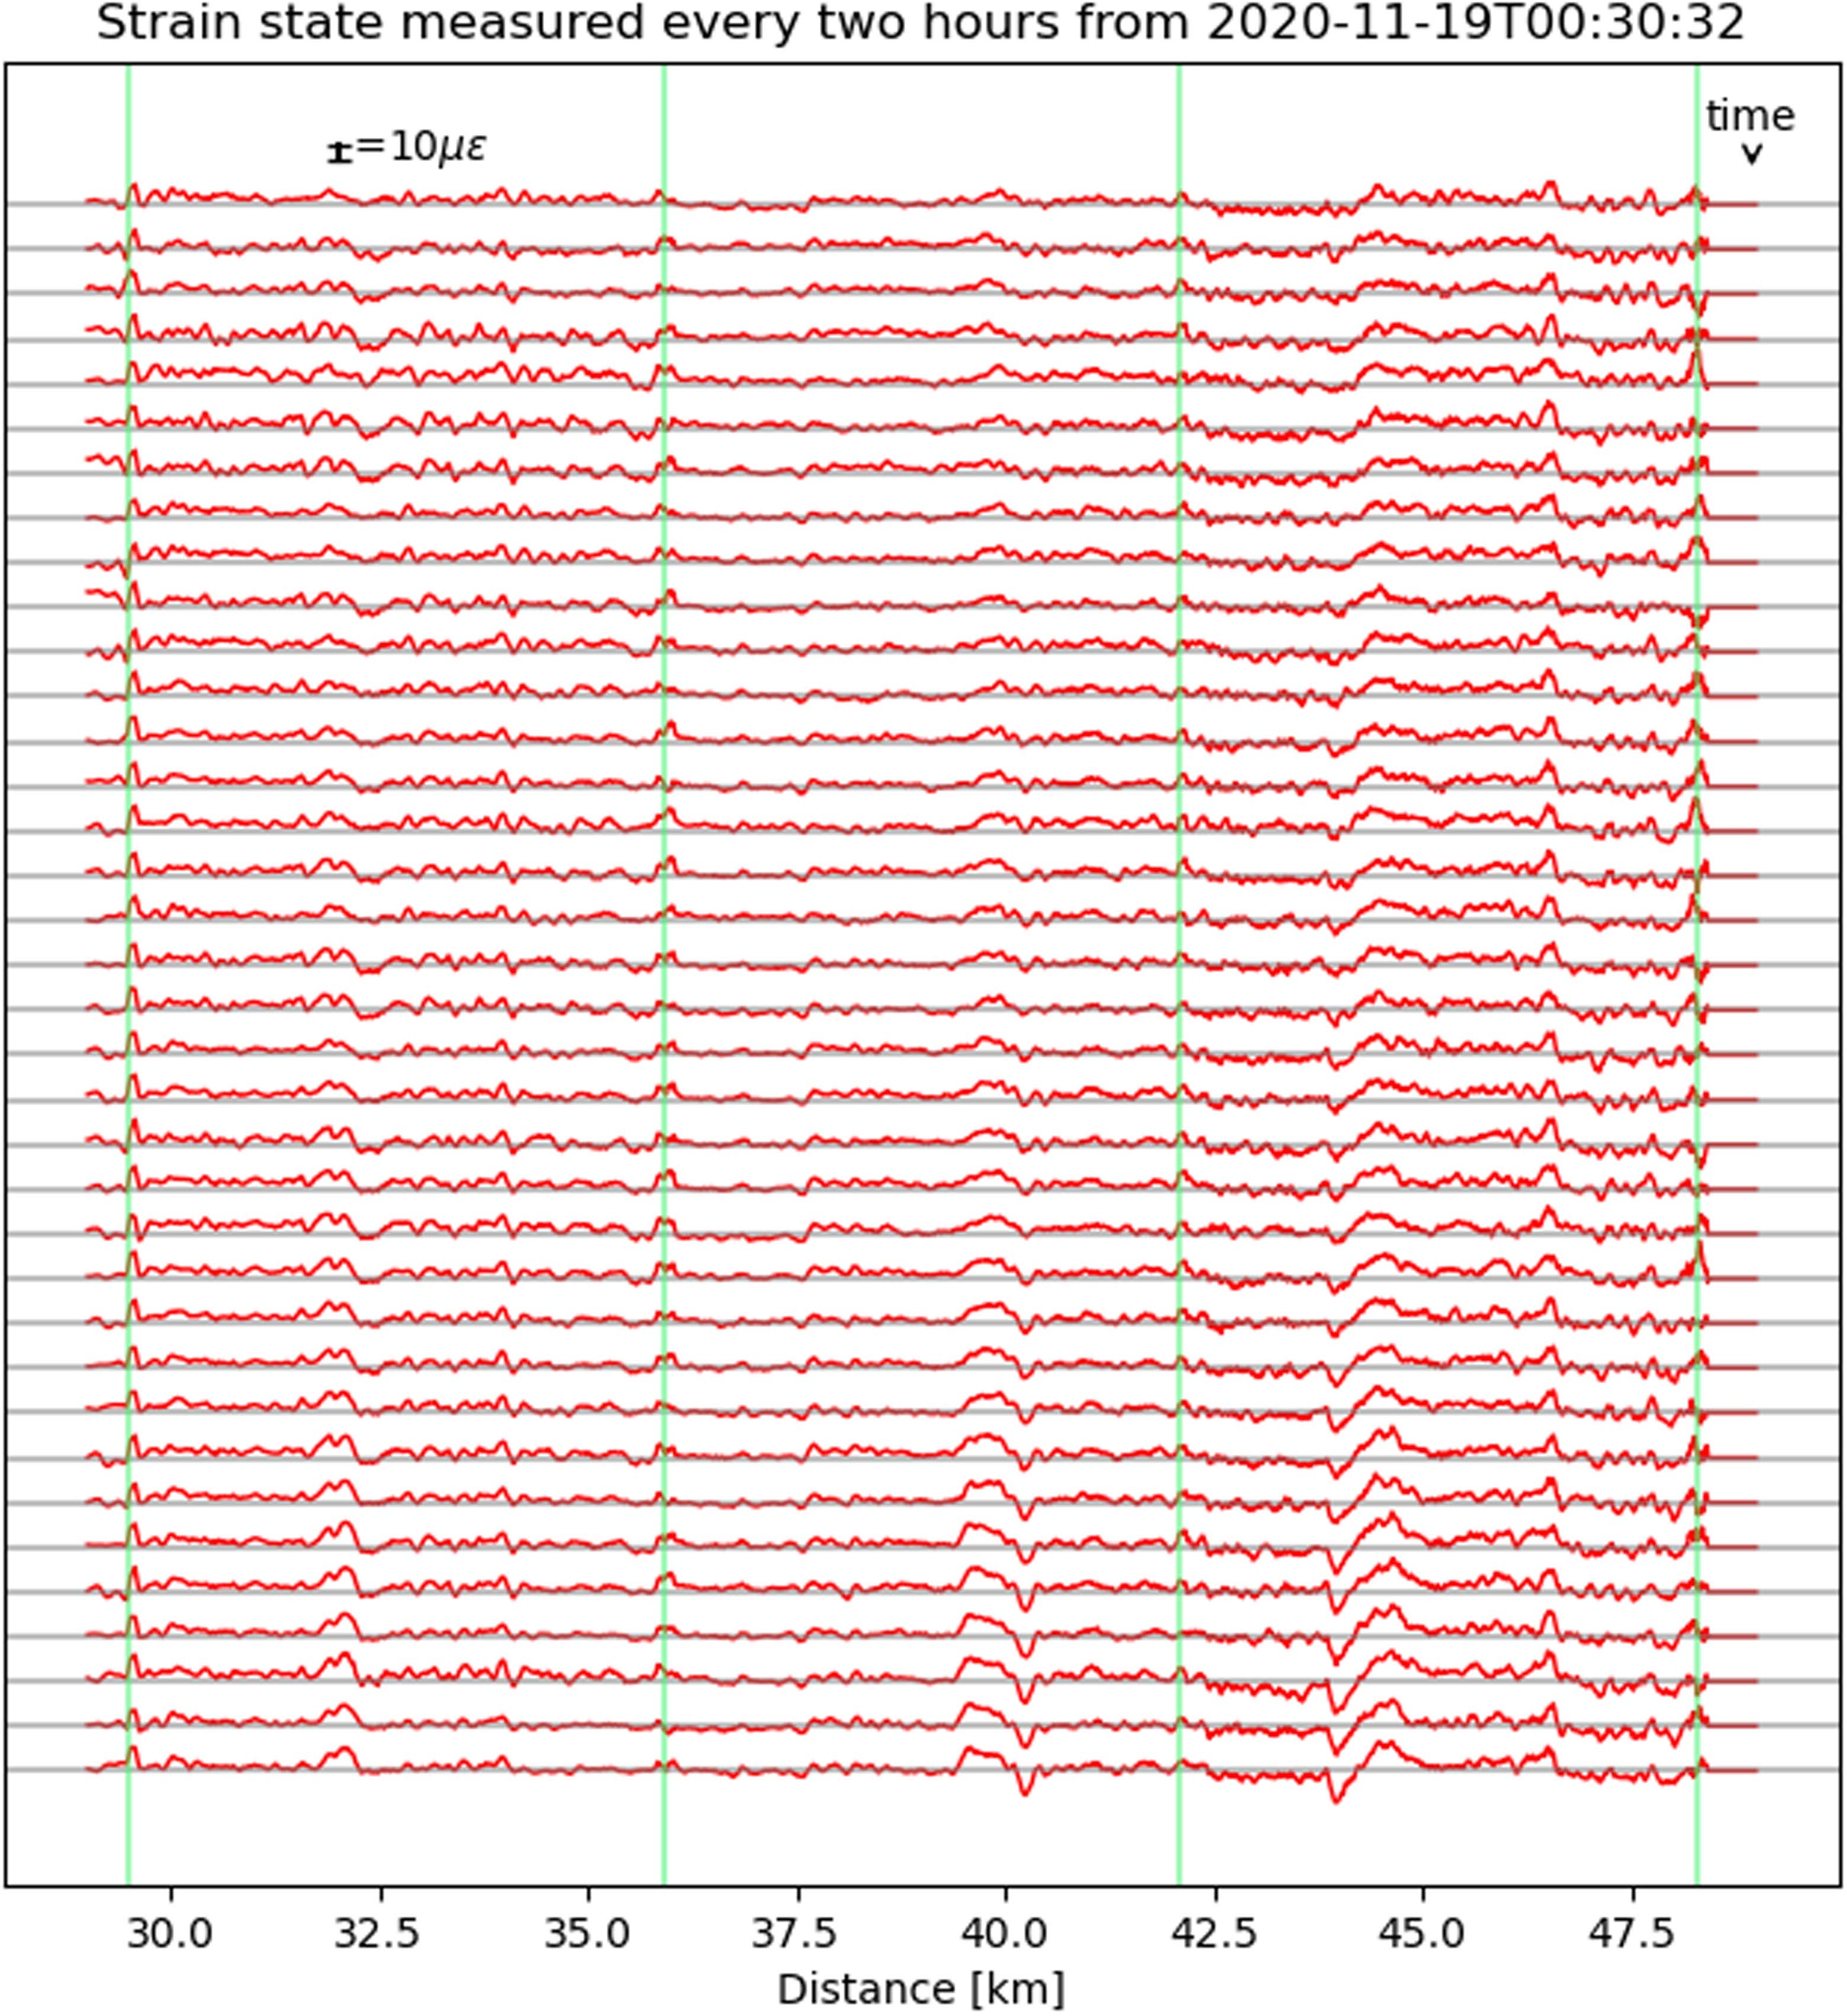
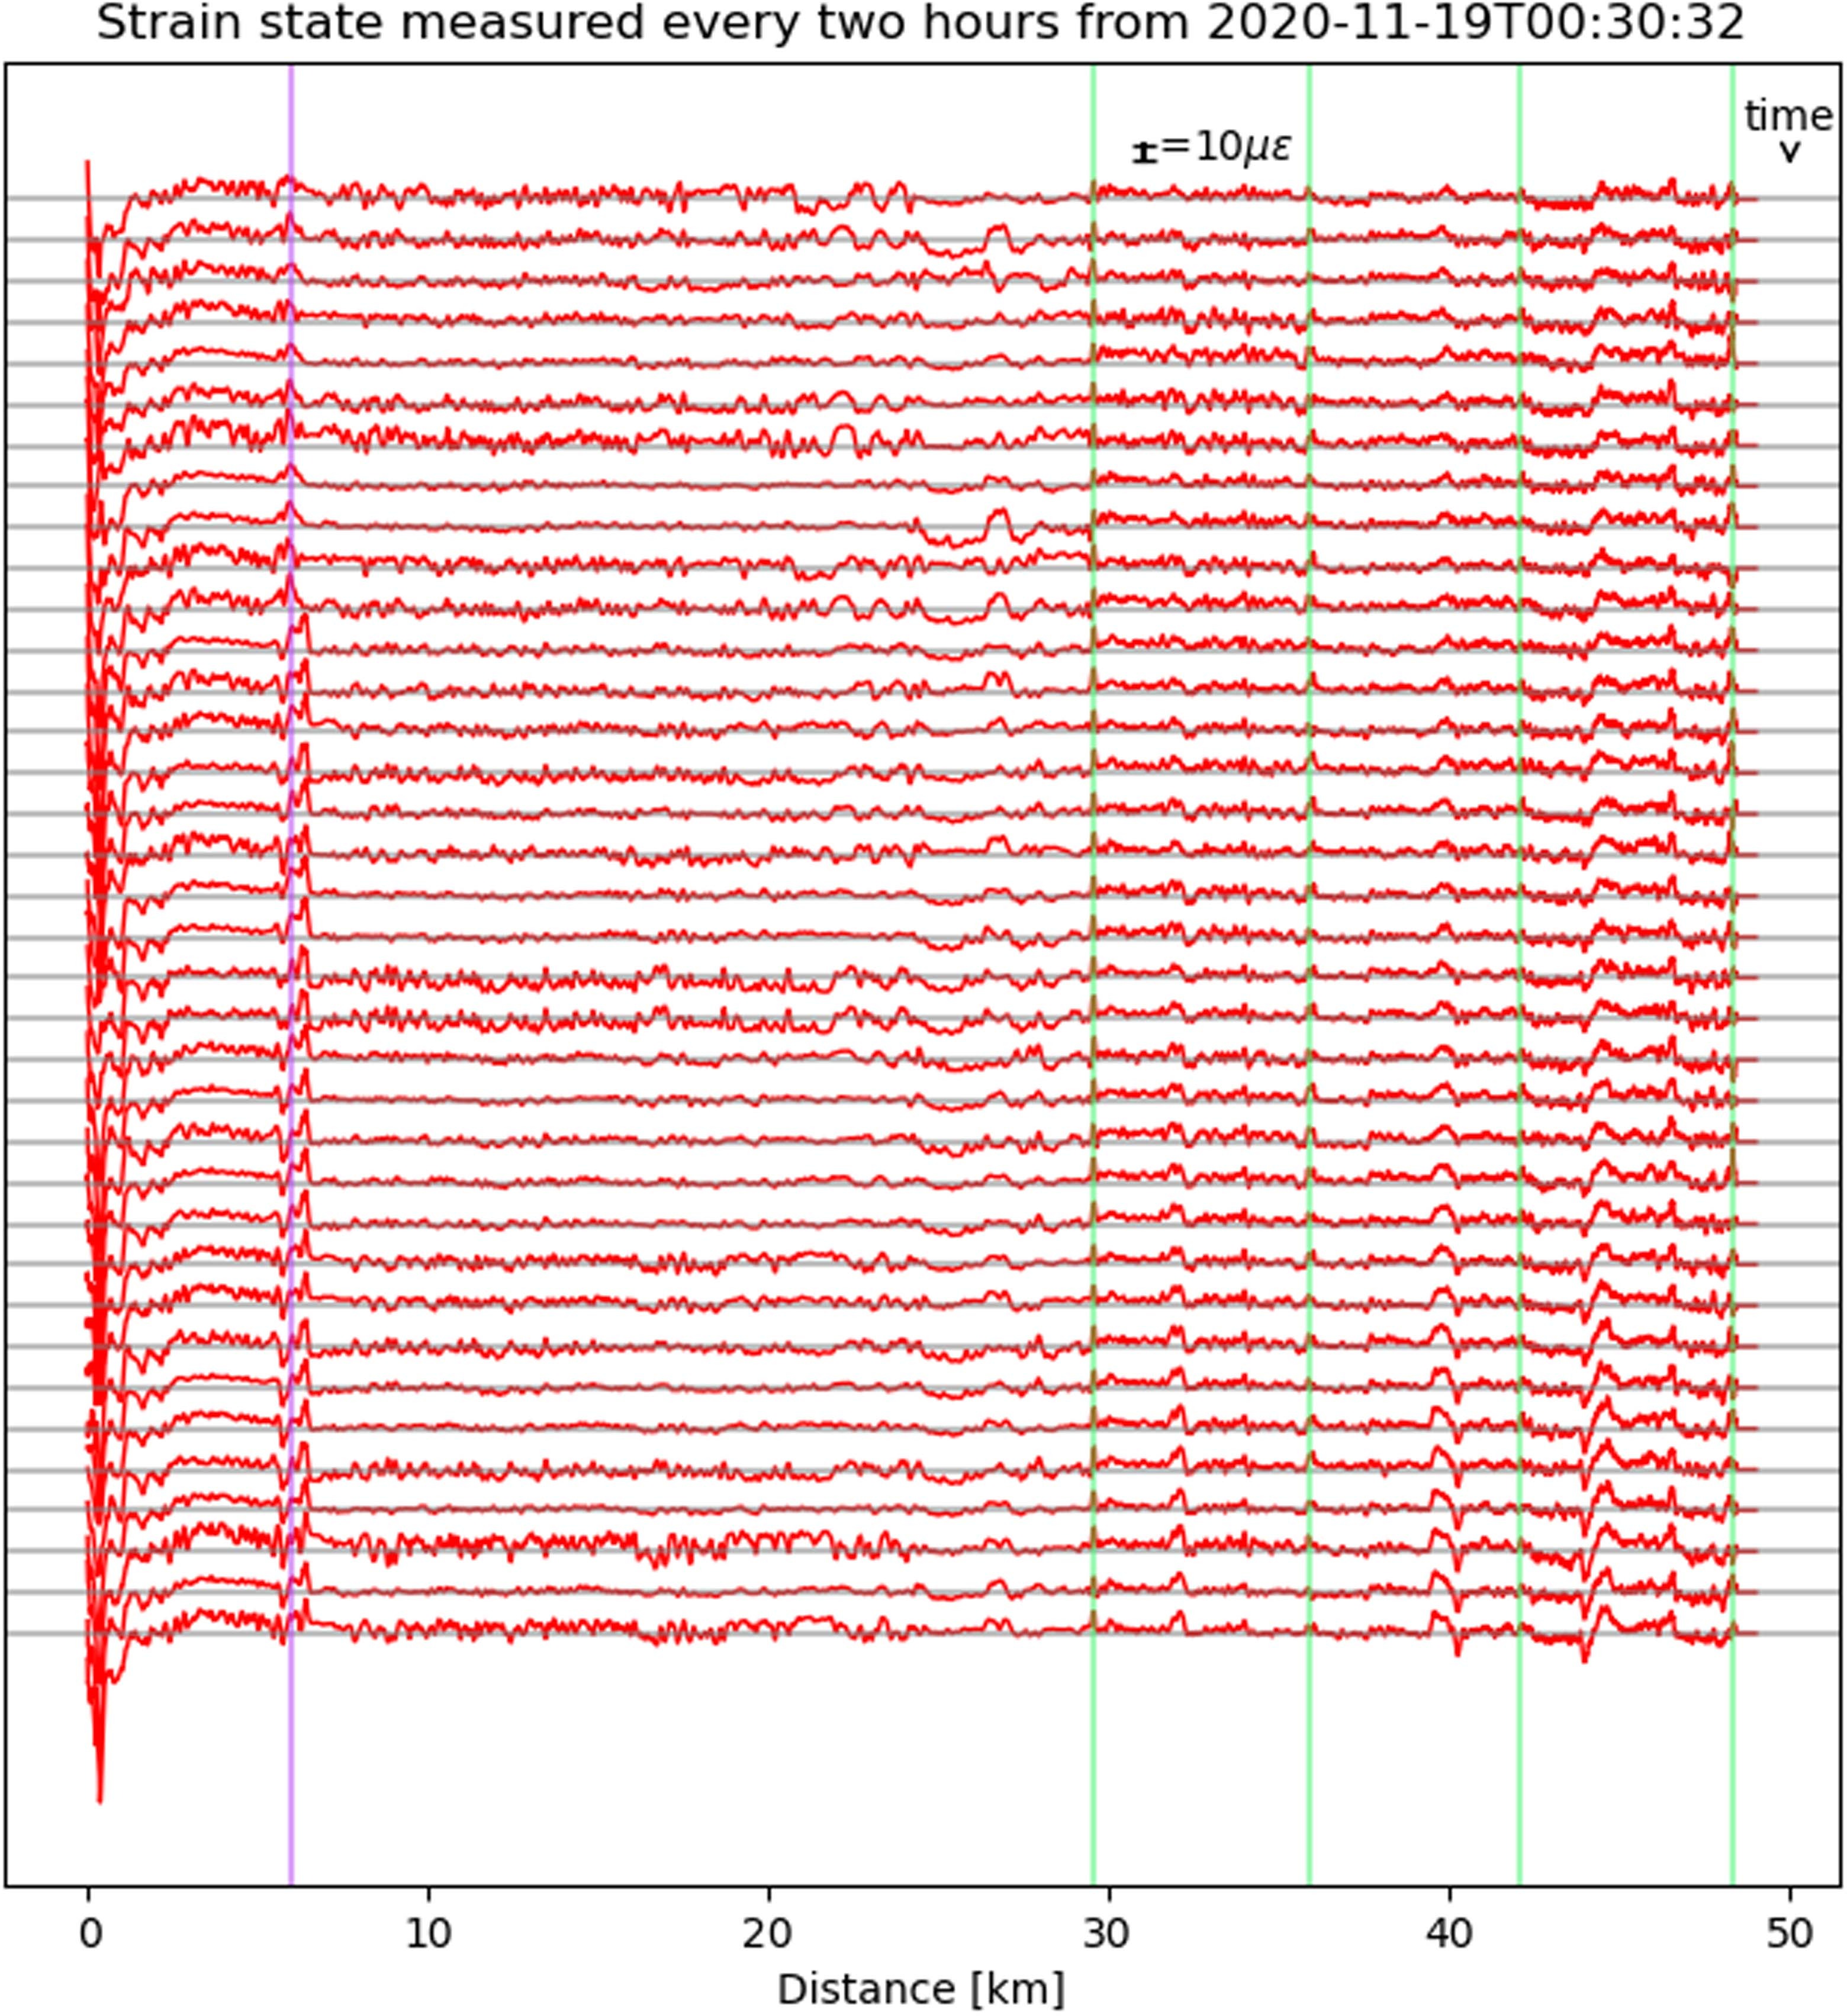
Figure S5. Strain evolution through time, for the entire 48-km-long optical path, (including the 29-km-long electro-optical cable and the 19-km-long triple loop of the FOCUS strain cable), over ...
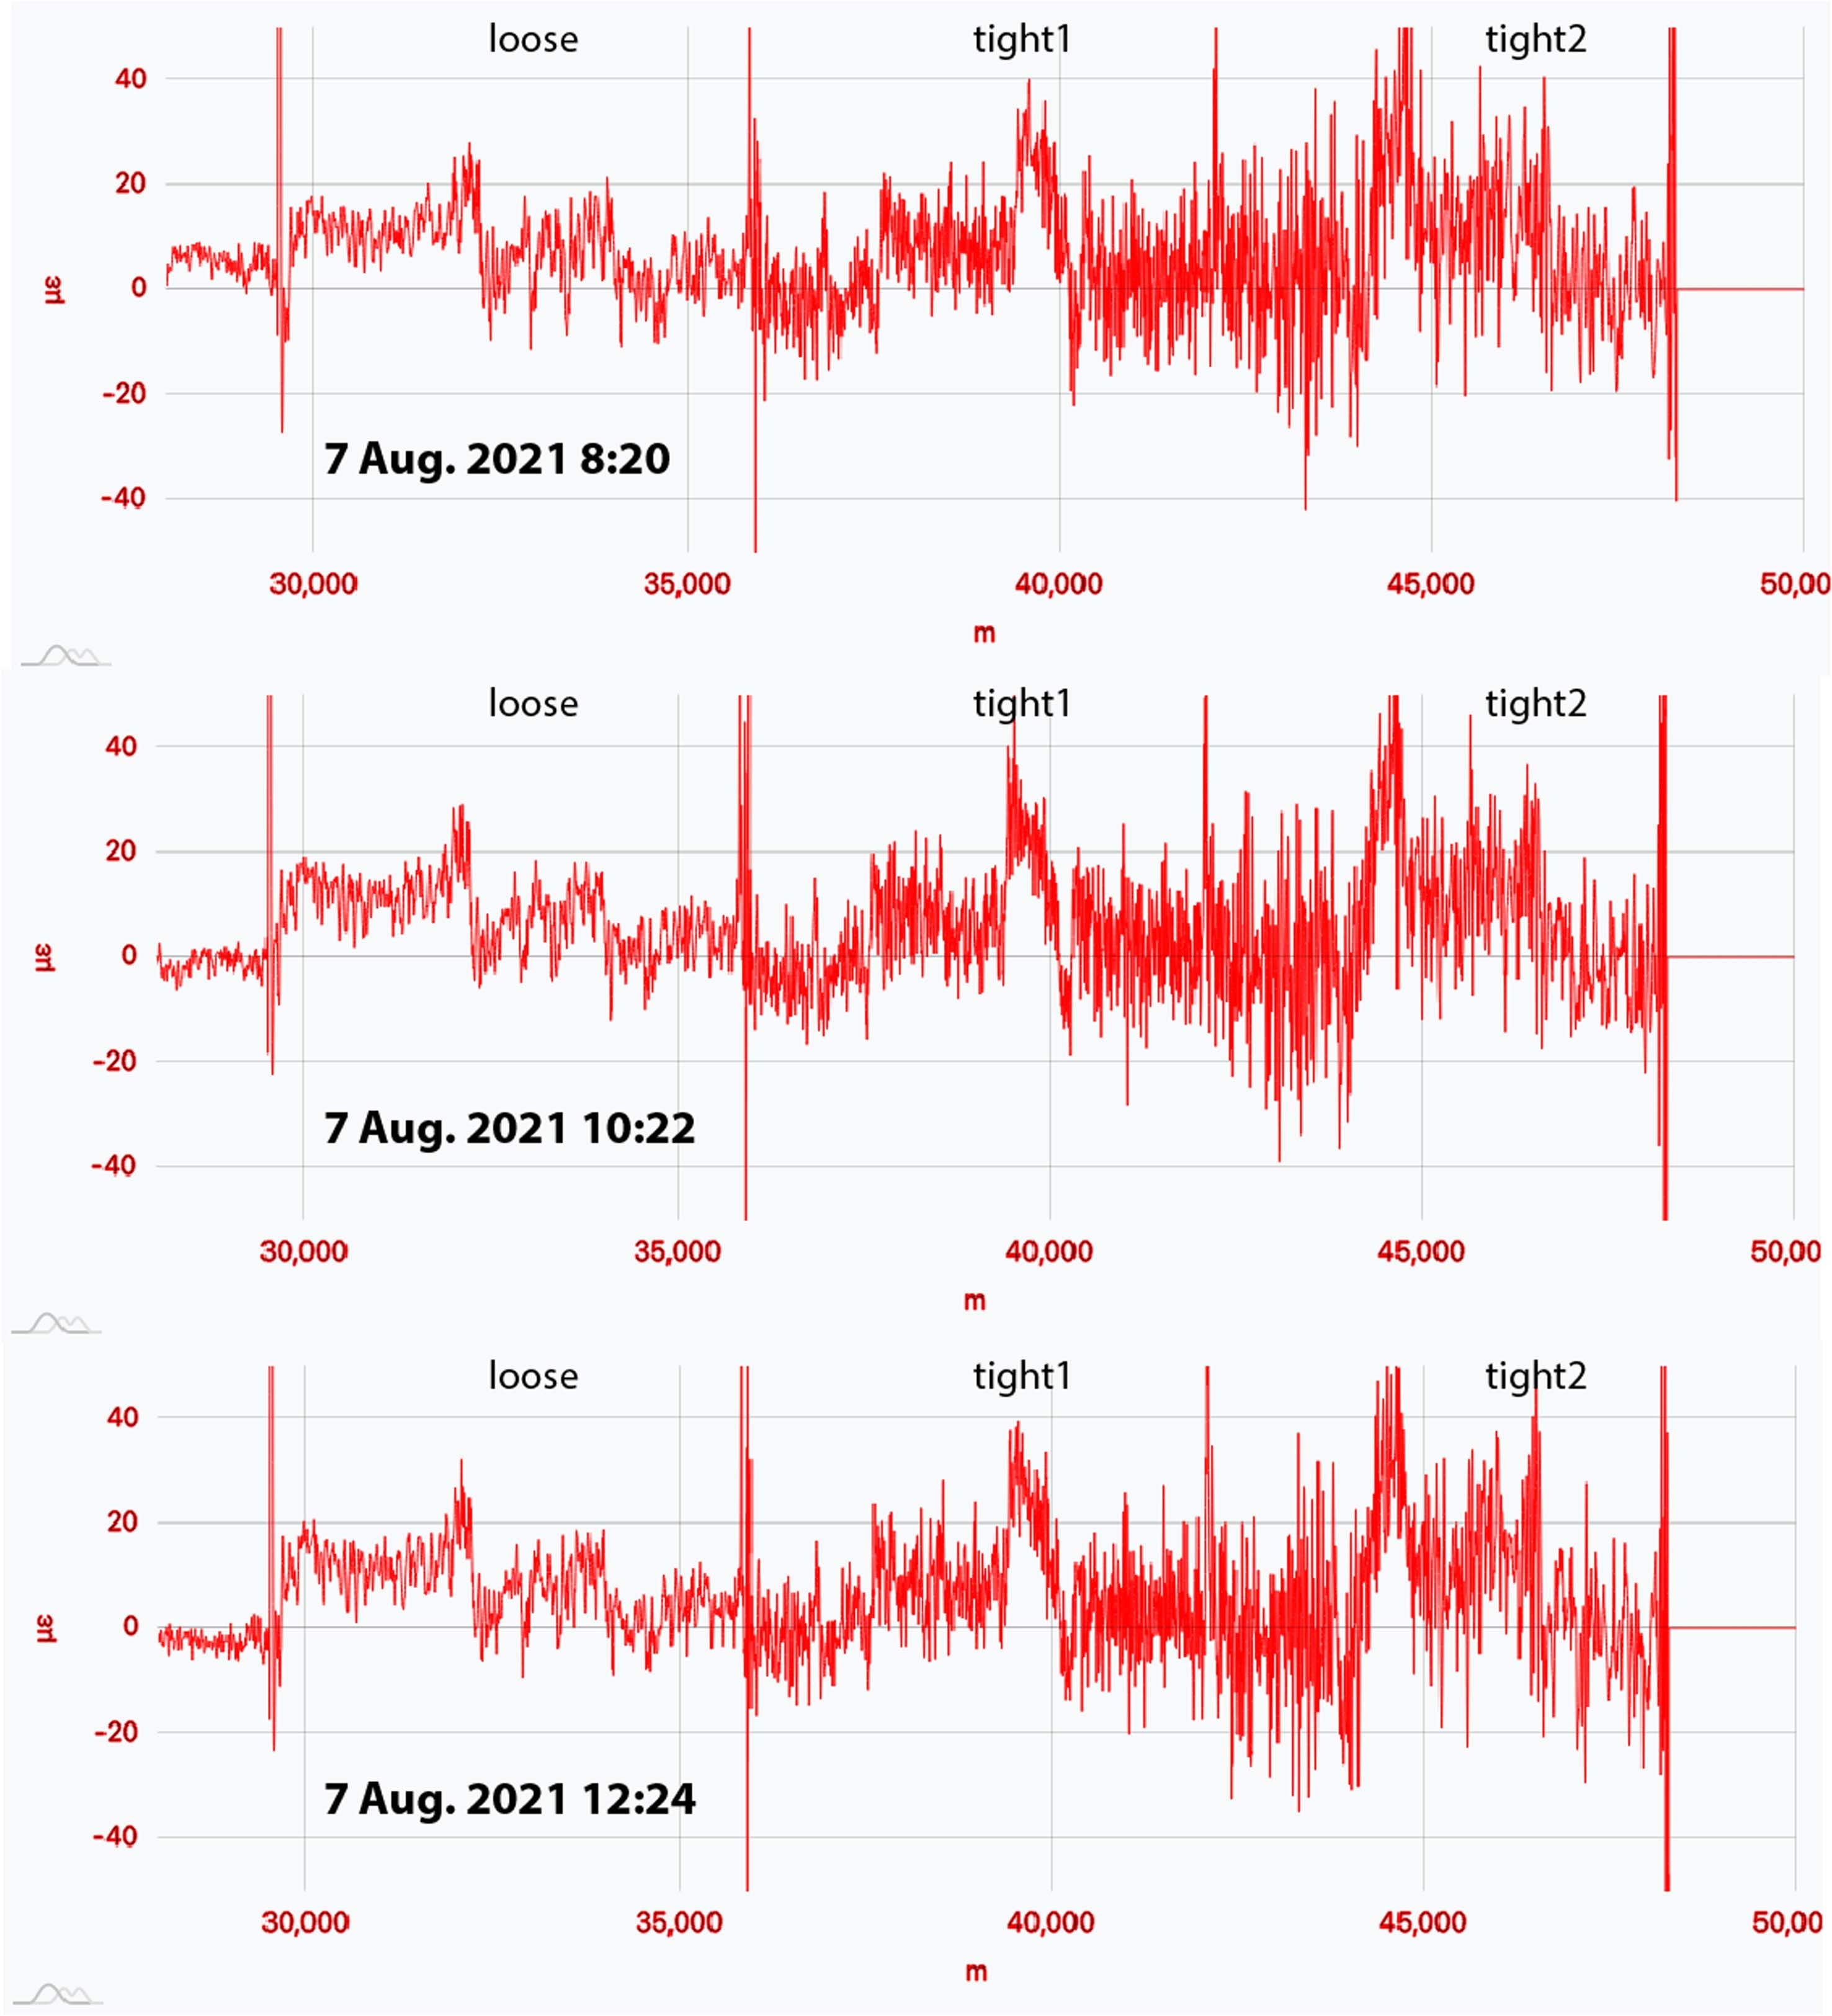
Figure S6. Three successive BOTDR measurements for the three-fold loop of the FOCUS strain cable, (loose, tight fiber 1 and tight fiber 2) from 7 August 2021 at two-hour intervals...
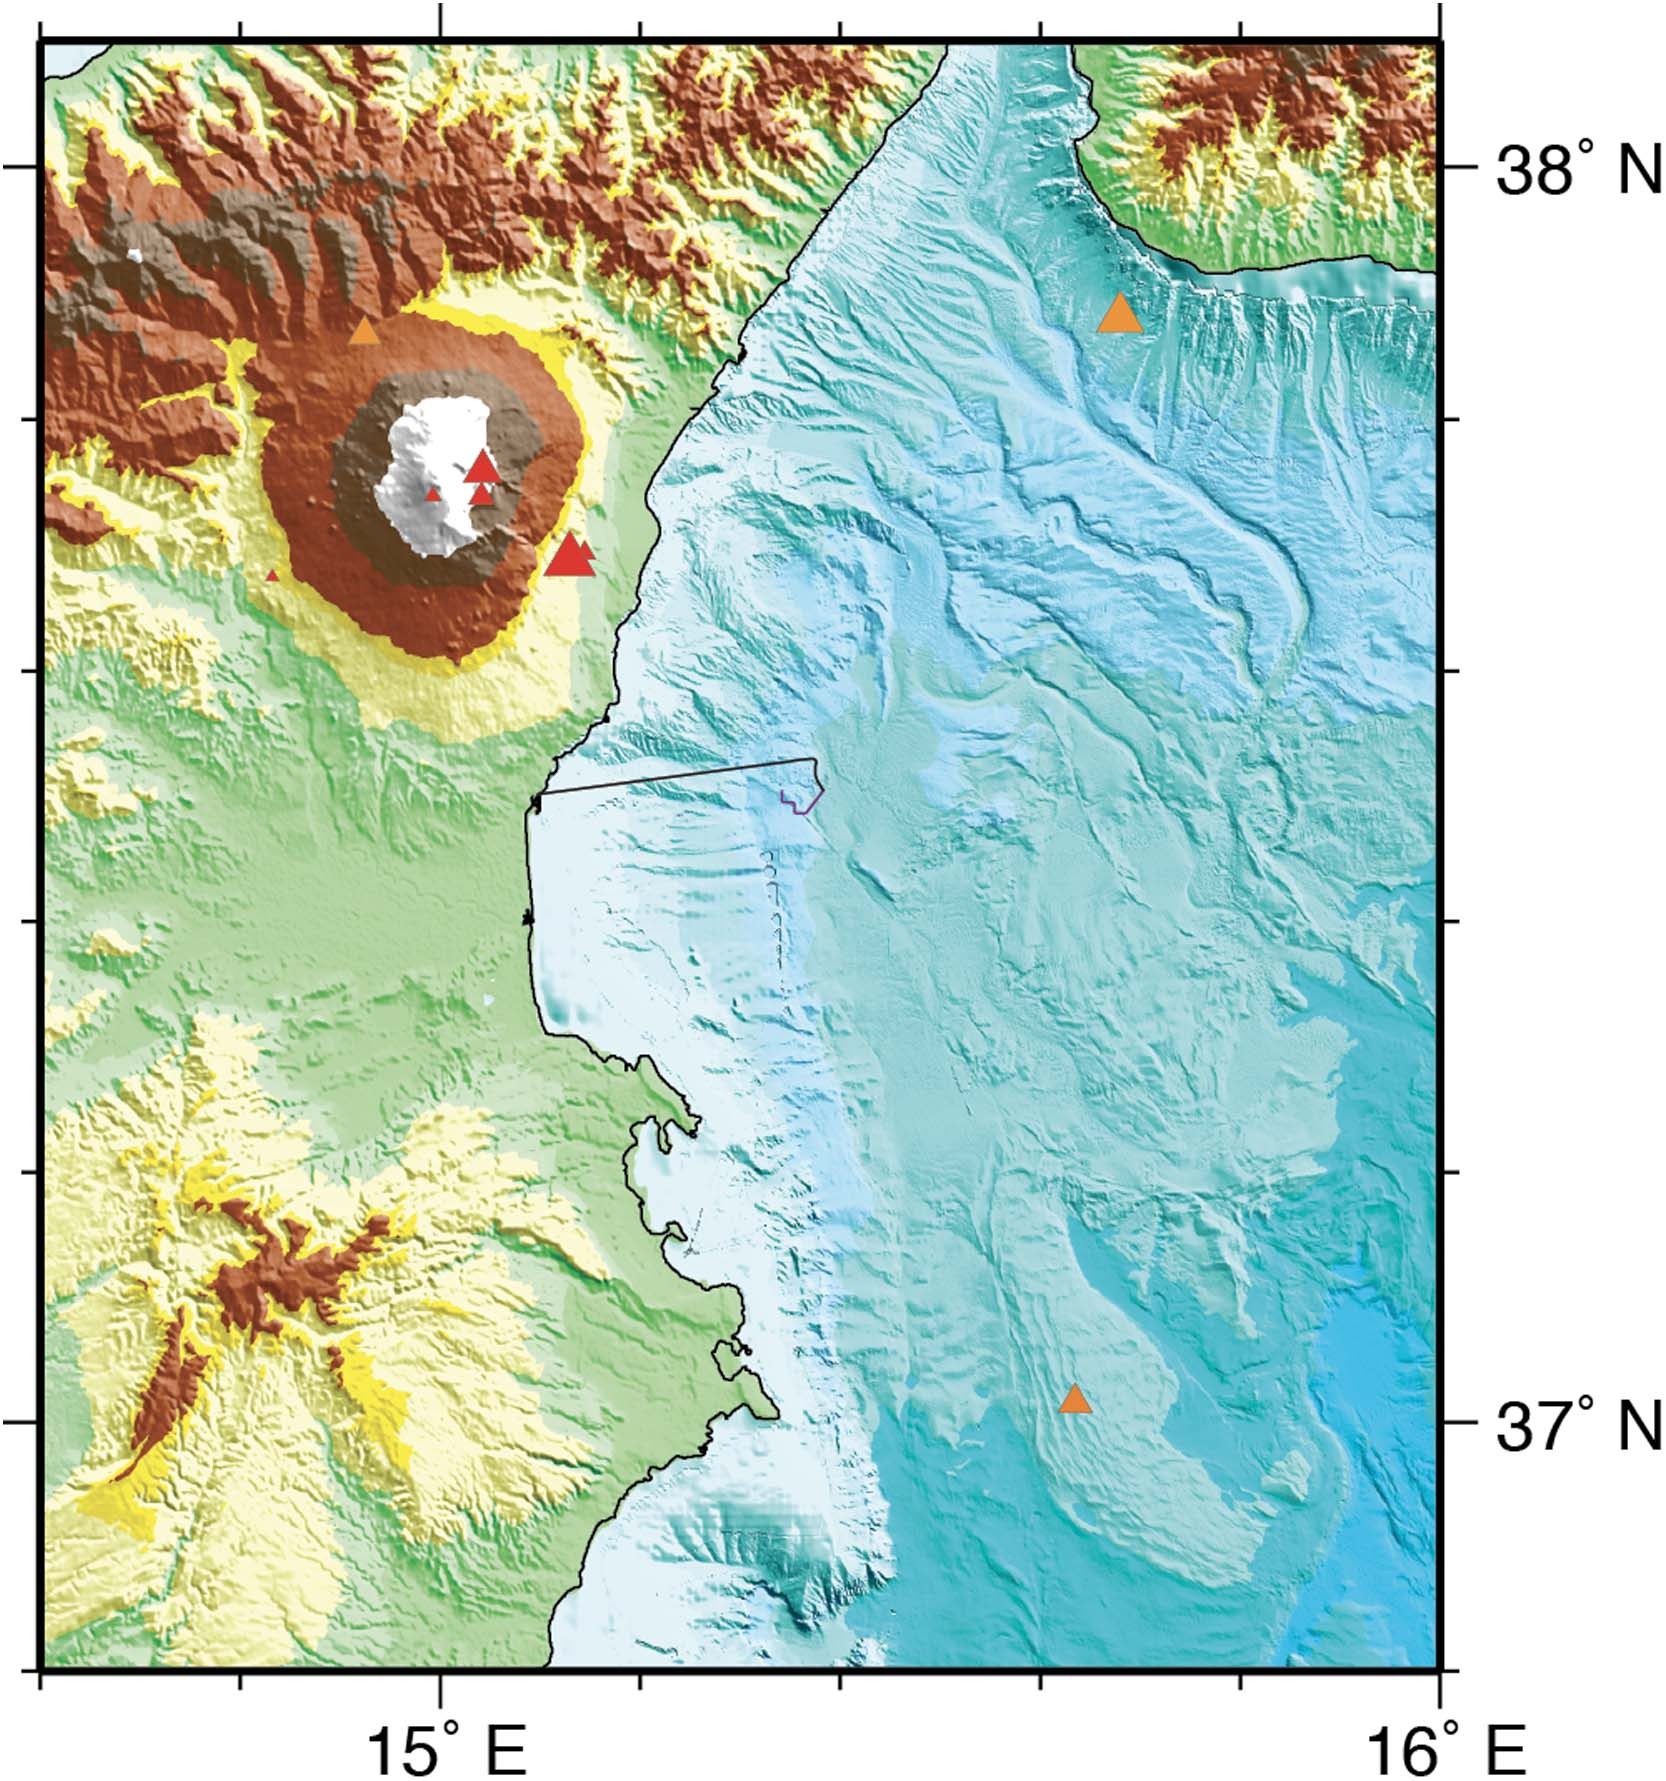
Figure S7. Relief map of the Etna region in Eastern Sicily and adjacent Ionian Sea, with seismicity from the INGV catalog (19–21 Nov. 2020) shown as red and yellow triangles, with relief (topography,
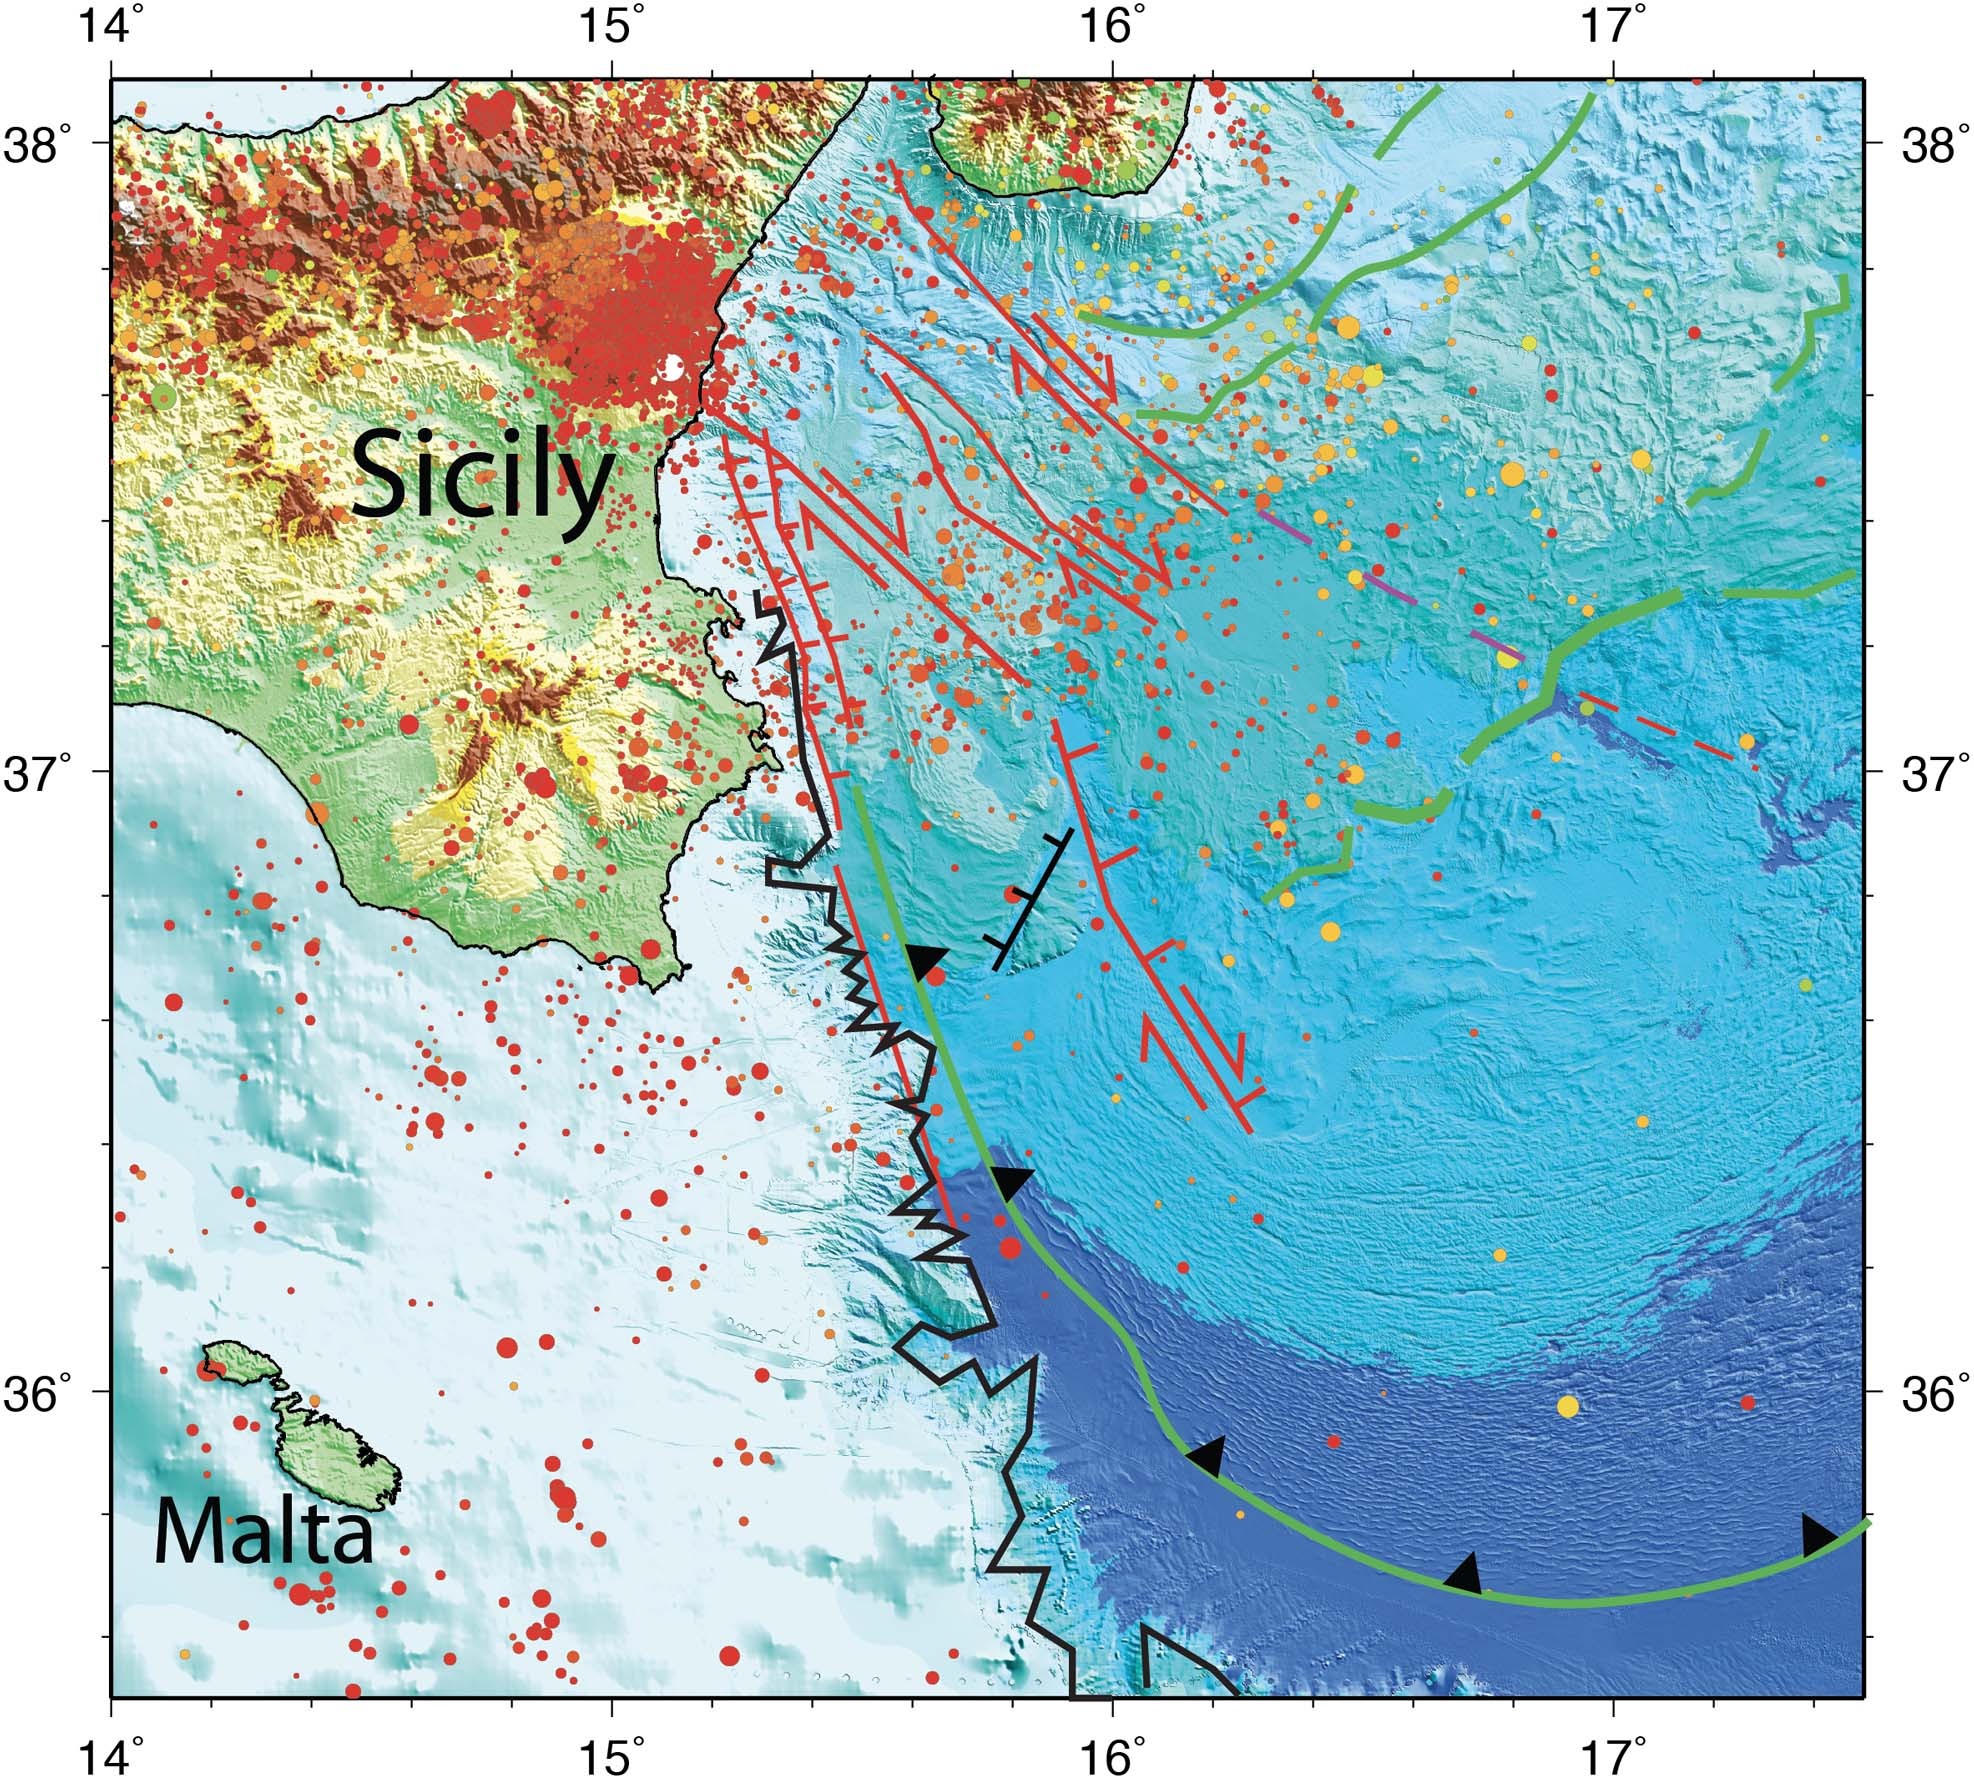
Figure S8. Regional map of the Eastern Sicily/Ionian Sea region with seismicity from the INGV catalog (Jan 2000–Feb. 2023) shown as small red (0-10 km depth), to yellow (20–40 km depth) circles, with