A 70-year perspective on water-mass transformation in the Greenland Sea: From thermobaric to thermal convection
The hydrography of the central Greenland Sea was reconstructed from observations including bottle measurements, Conductivity/Temperature/Depth (CTD) measurements, and Argo floats for the period 1950 to 2020. Greenland Sea Deep Water was renewed during bottom-reaching convection prior to the mid-1980s, facilitated by the thermobaric effect. During a period of shallow convection in the late 1980s and early 1990s, a stratification maximum formed and isolated the deep from the intermediate Greenland Sea. As a consequence, convection was limited to depths shallower than 2000 m during the past decades and a new class of intermediate water formed instead of deep water. The initial cause for the formation of the stratification maximum was a near-surface freshwater anomaly. A subsequent, rapid temperature and salinity increase in the upper 2000 m resulted in an overall density reduction of the intermediate water which strengthened the stratification maximum. Along with the transition from formation of deep water to formation of intermediate water, the Greenland Sea became temperature-stratified at intermediate depths. This regime-shift in stratification can be traced to increased temperature and salinity in the inflowing Atlantic-origin Water. Below the stratification maximum, the Greenland Sea Deep Water became warmer and more saline, predominantly caused by lateral mixing with deep water masses from adjacent basins. The hydrographic changes in the Greenland Sea were investigated in the context of a reduction of the sea-ice extent and associated changes in winter heat loss. While interannual variability of convection depth may depend on atmospheric forcing, we found that the decadal variability of water-mass transformation in the Greenland Sea was largely determined by the hydrographic structure of the water column.
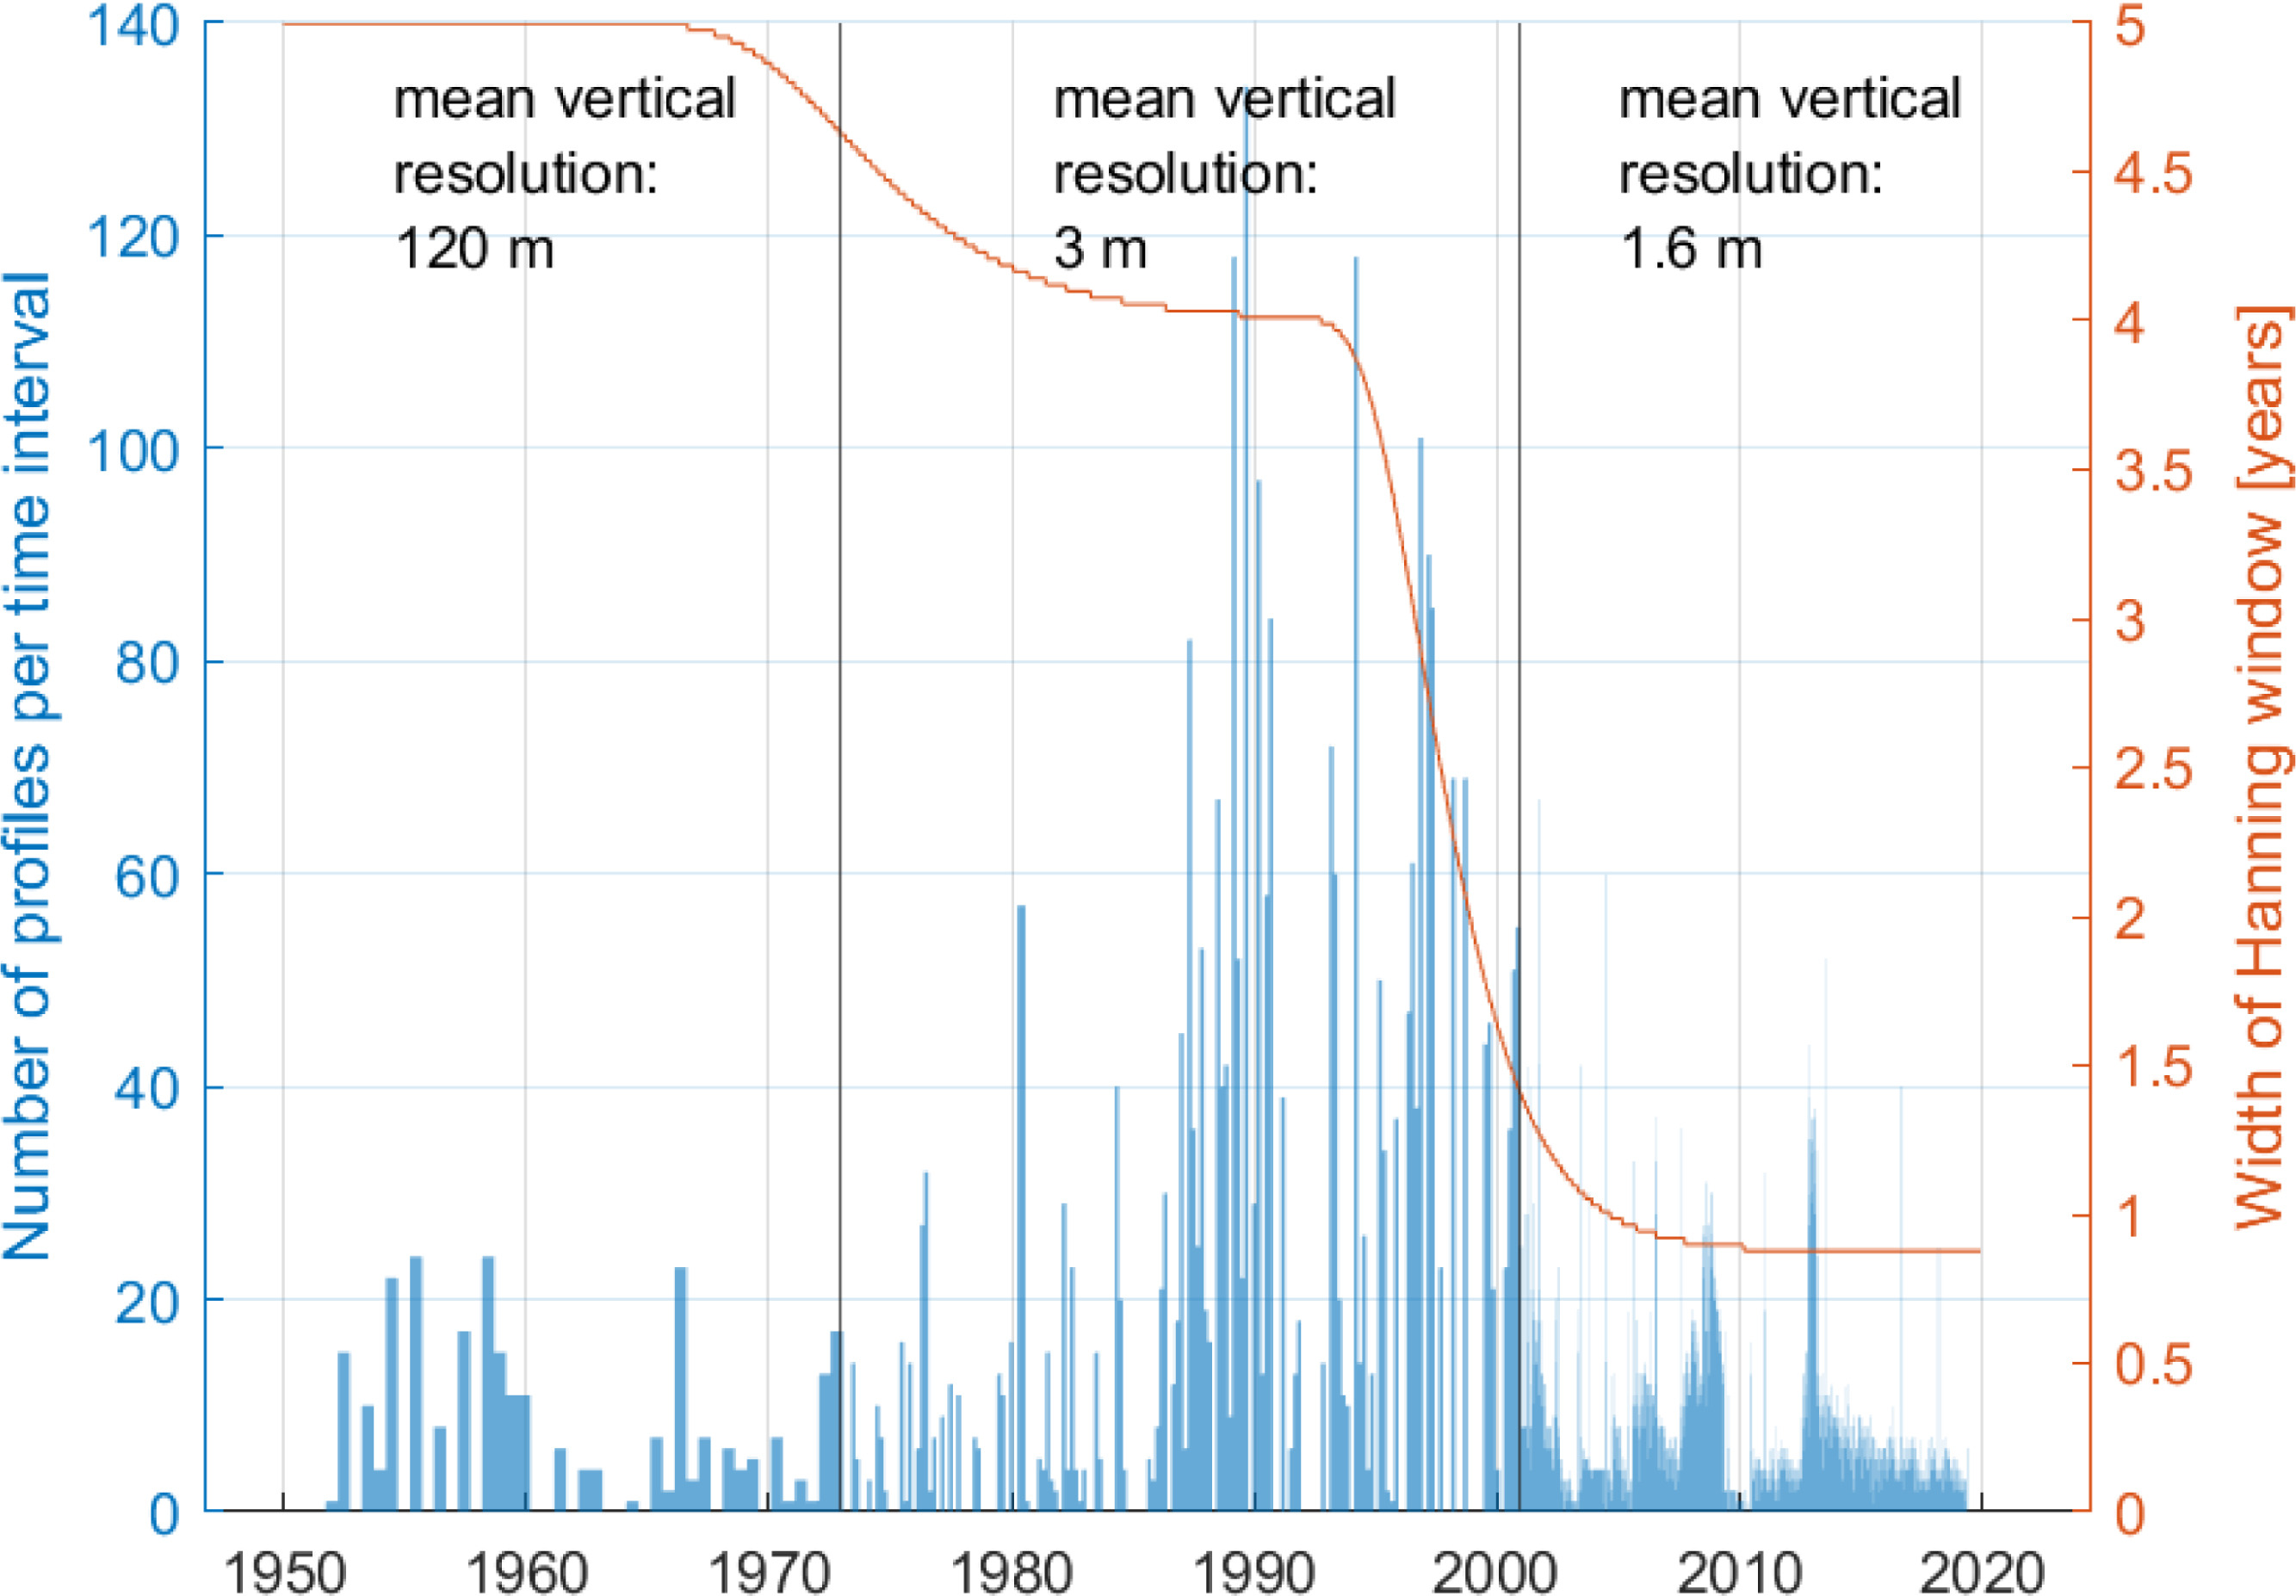
Fig. A.1.1. Temporal data availability and vertical resolution for the entire 70-year period. The spacing on the time axis reflects the temporal resolution applied when gridding the different periods.
Fig. A.1.2. Visualization of the step-wise gridding process. The step-wise increase in resolution is illustrated by plotting every þ12 grid line in both time and depth. The red lines mark the ....
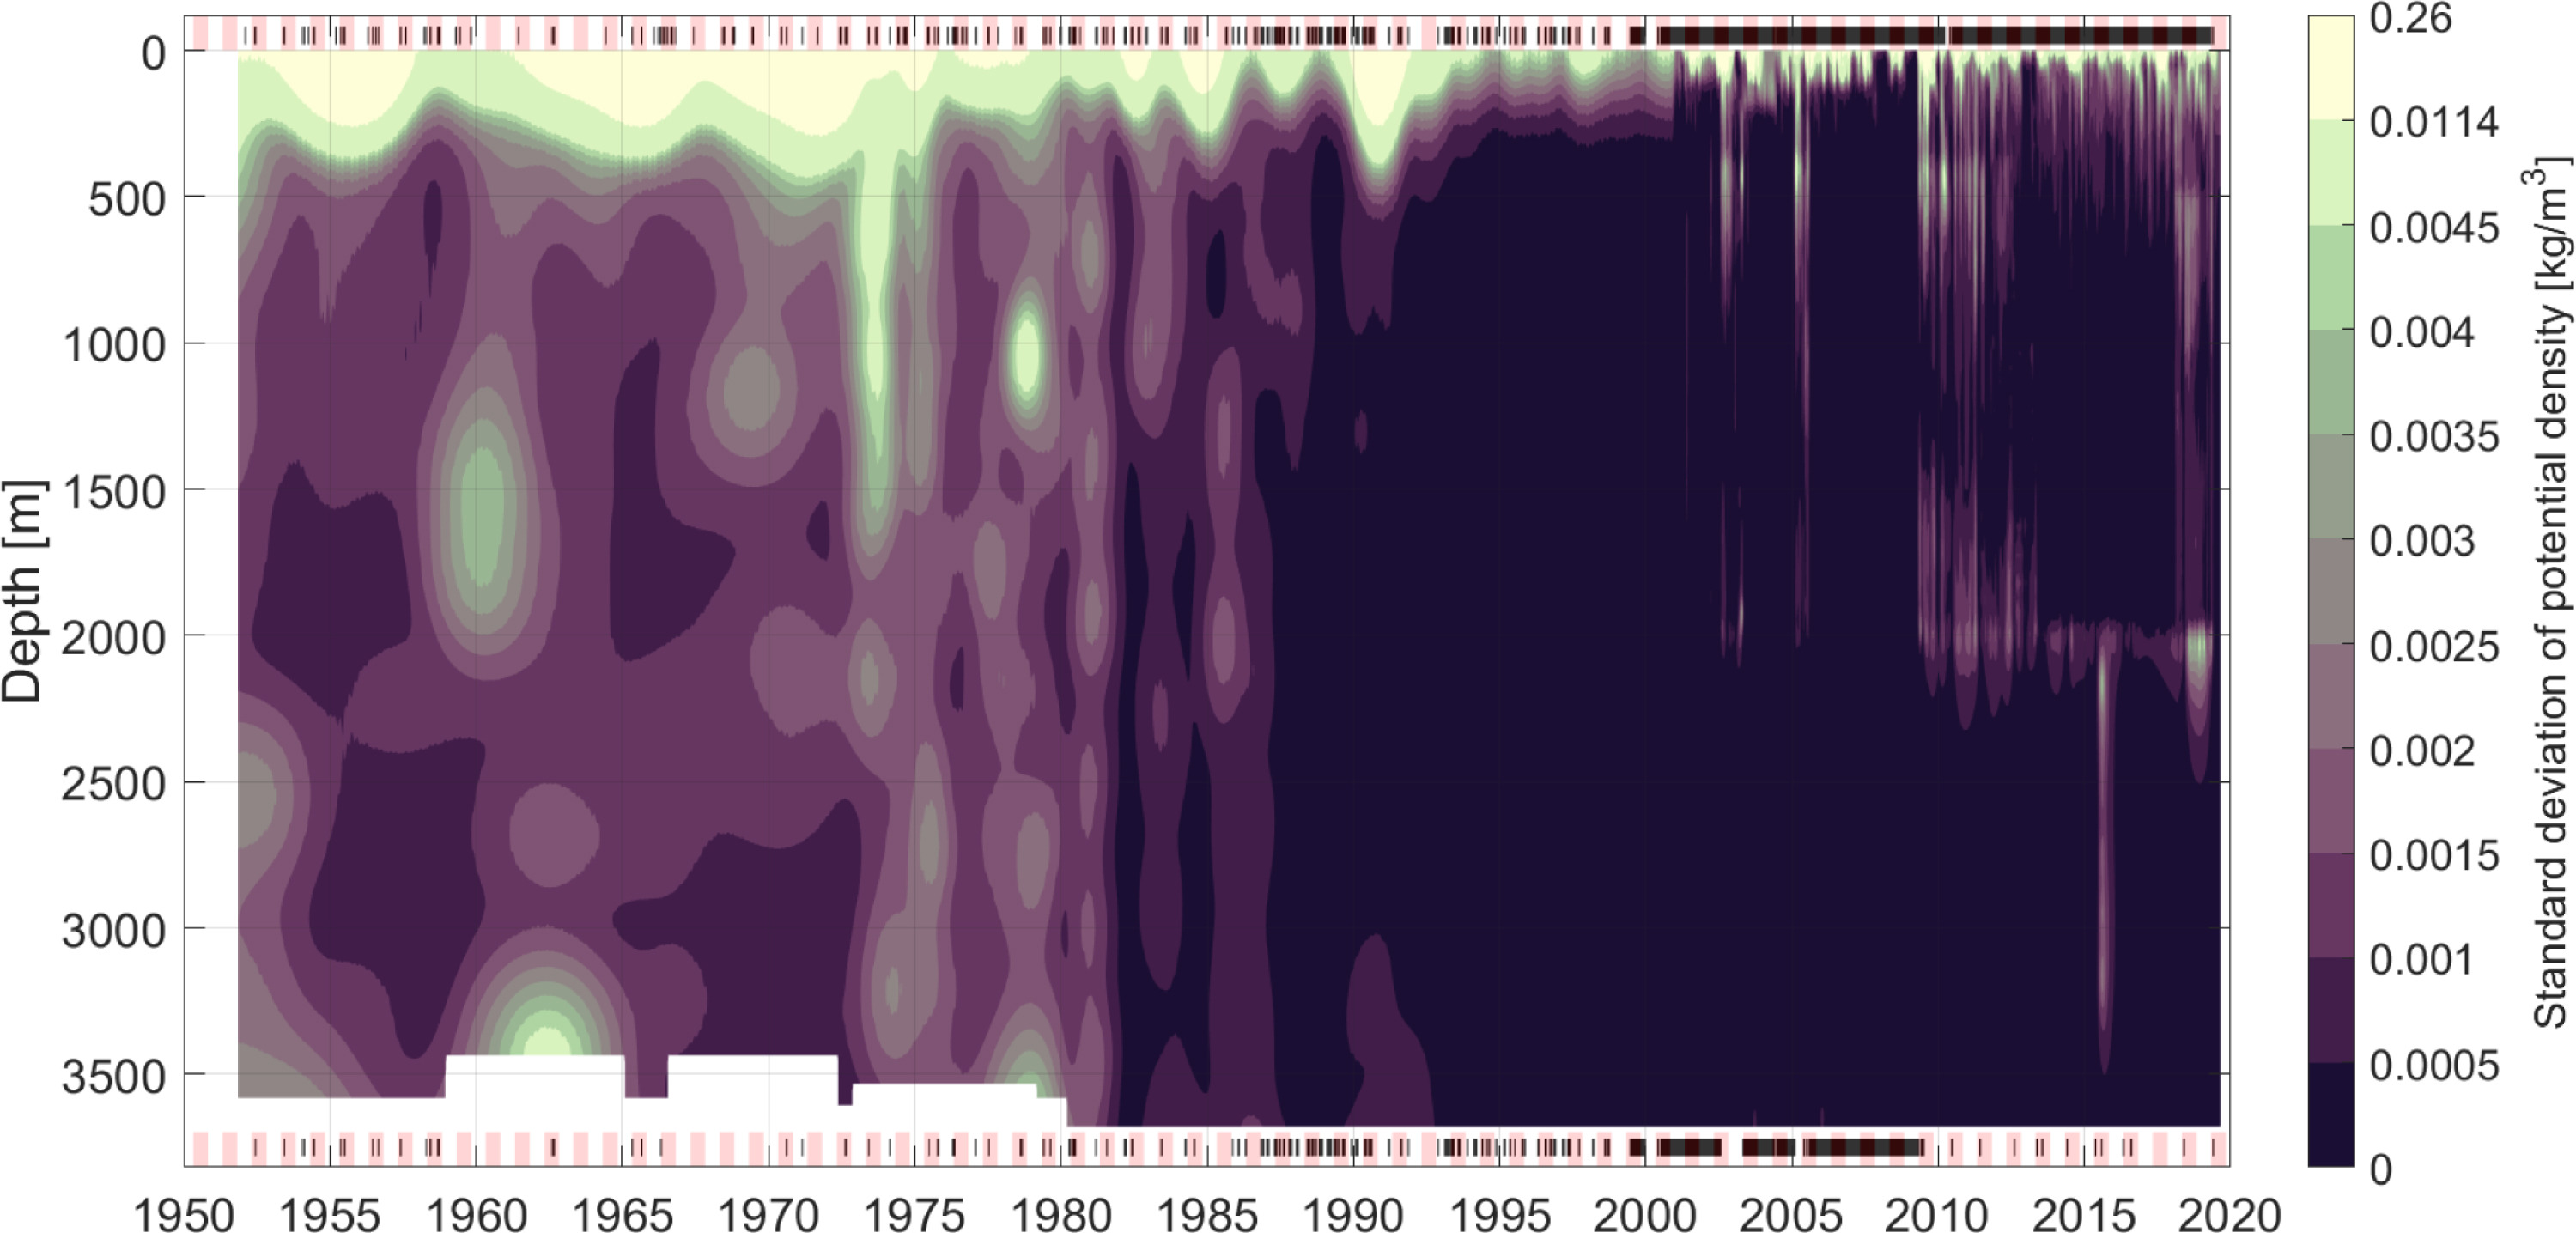
Fig. A.1.3. Standard deviation of potential density derived from gridding with 1000 bootstrap samples. The color scale is linear until the þ95 percentile of standard deviations...
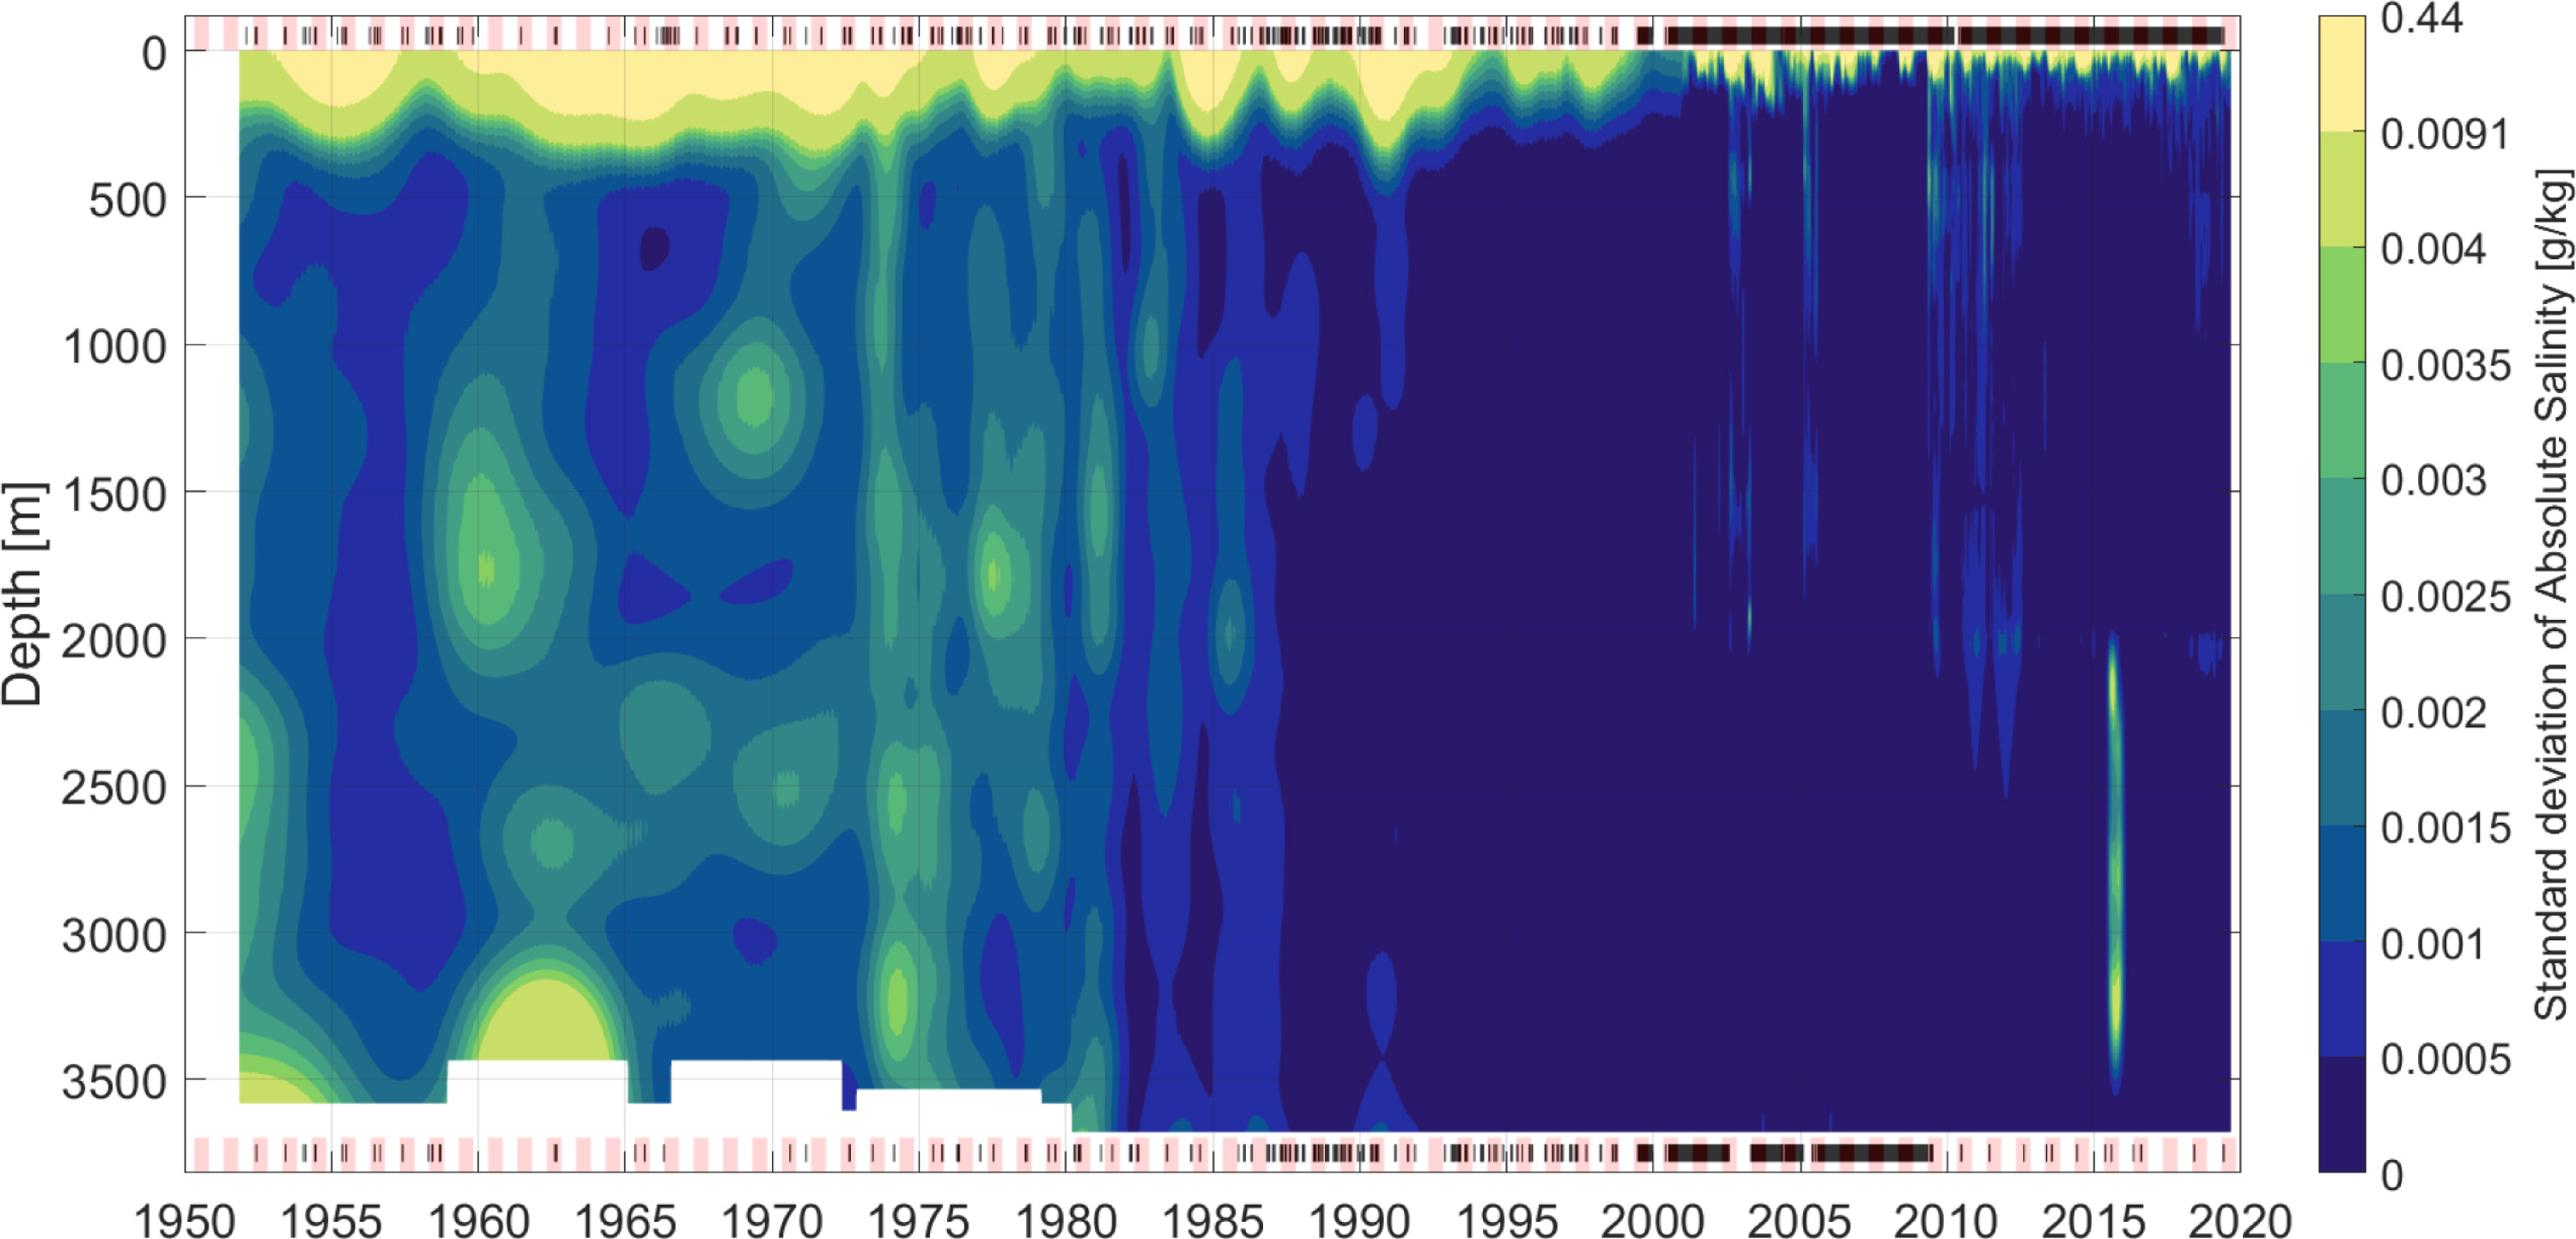
Fig. A.1.4. Standard deviation of absolute salinity derived from gridding with 1000 bootstrap samples. The color scale corresponds to that of density ...
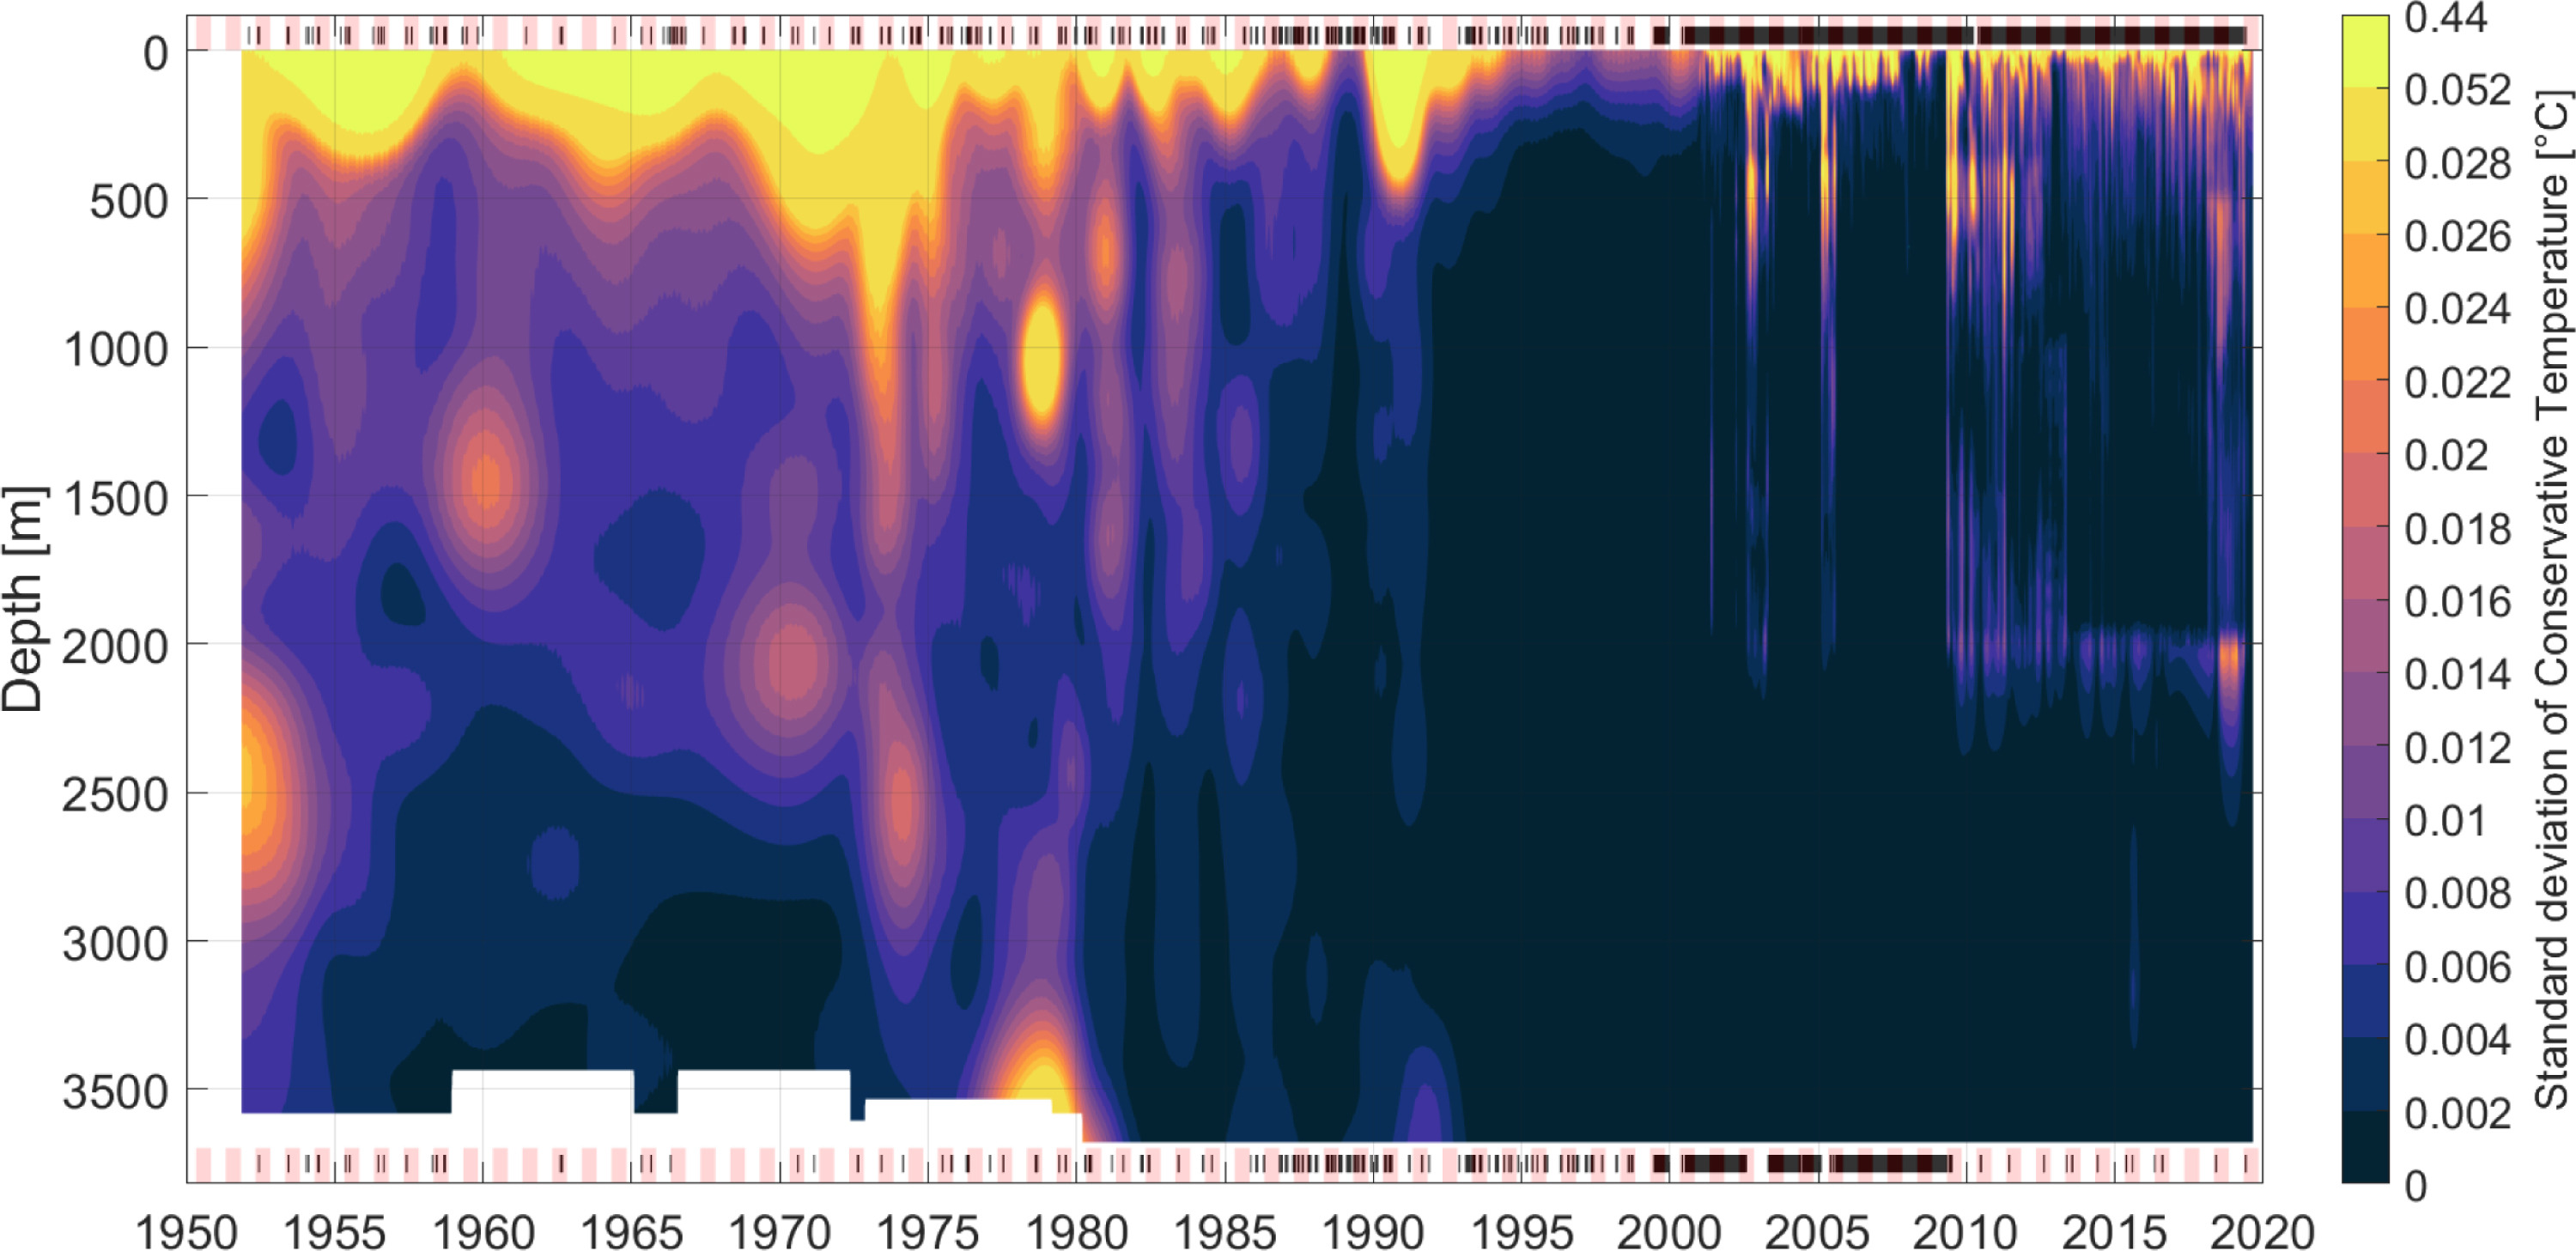
Fig. A.1.5. Standard deviation of conservative temperature derived from gridding with 1000 bootstrap samples. The color scale corresponds to that of density ...
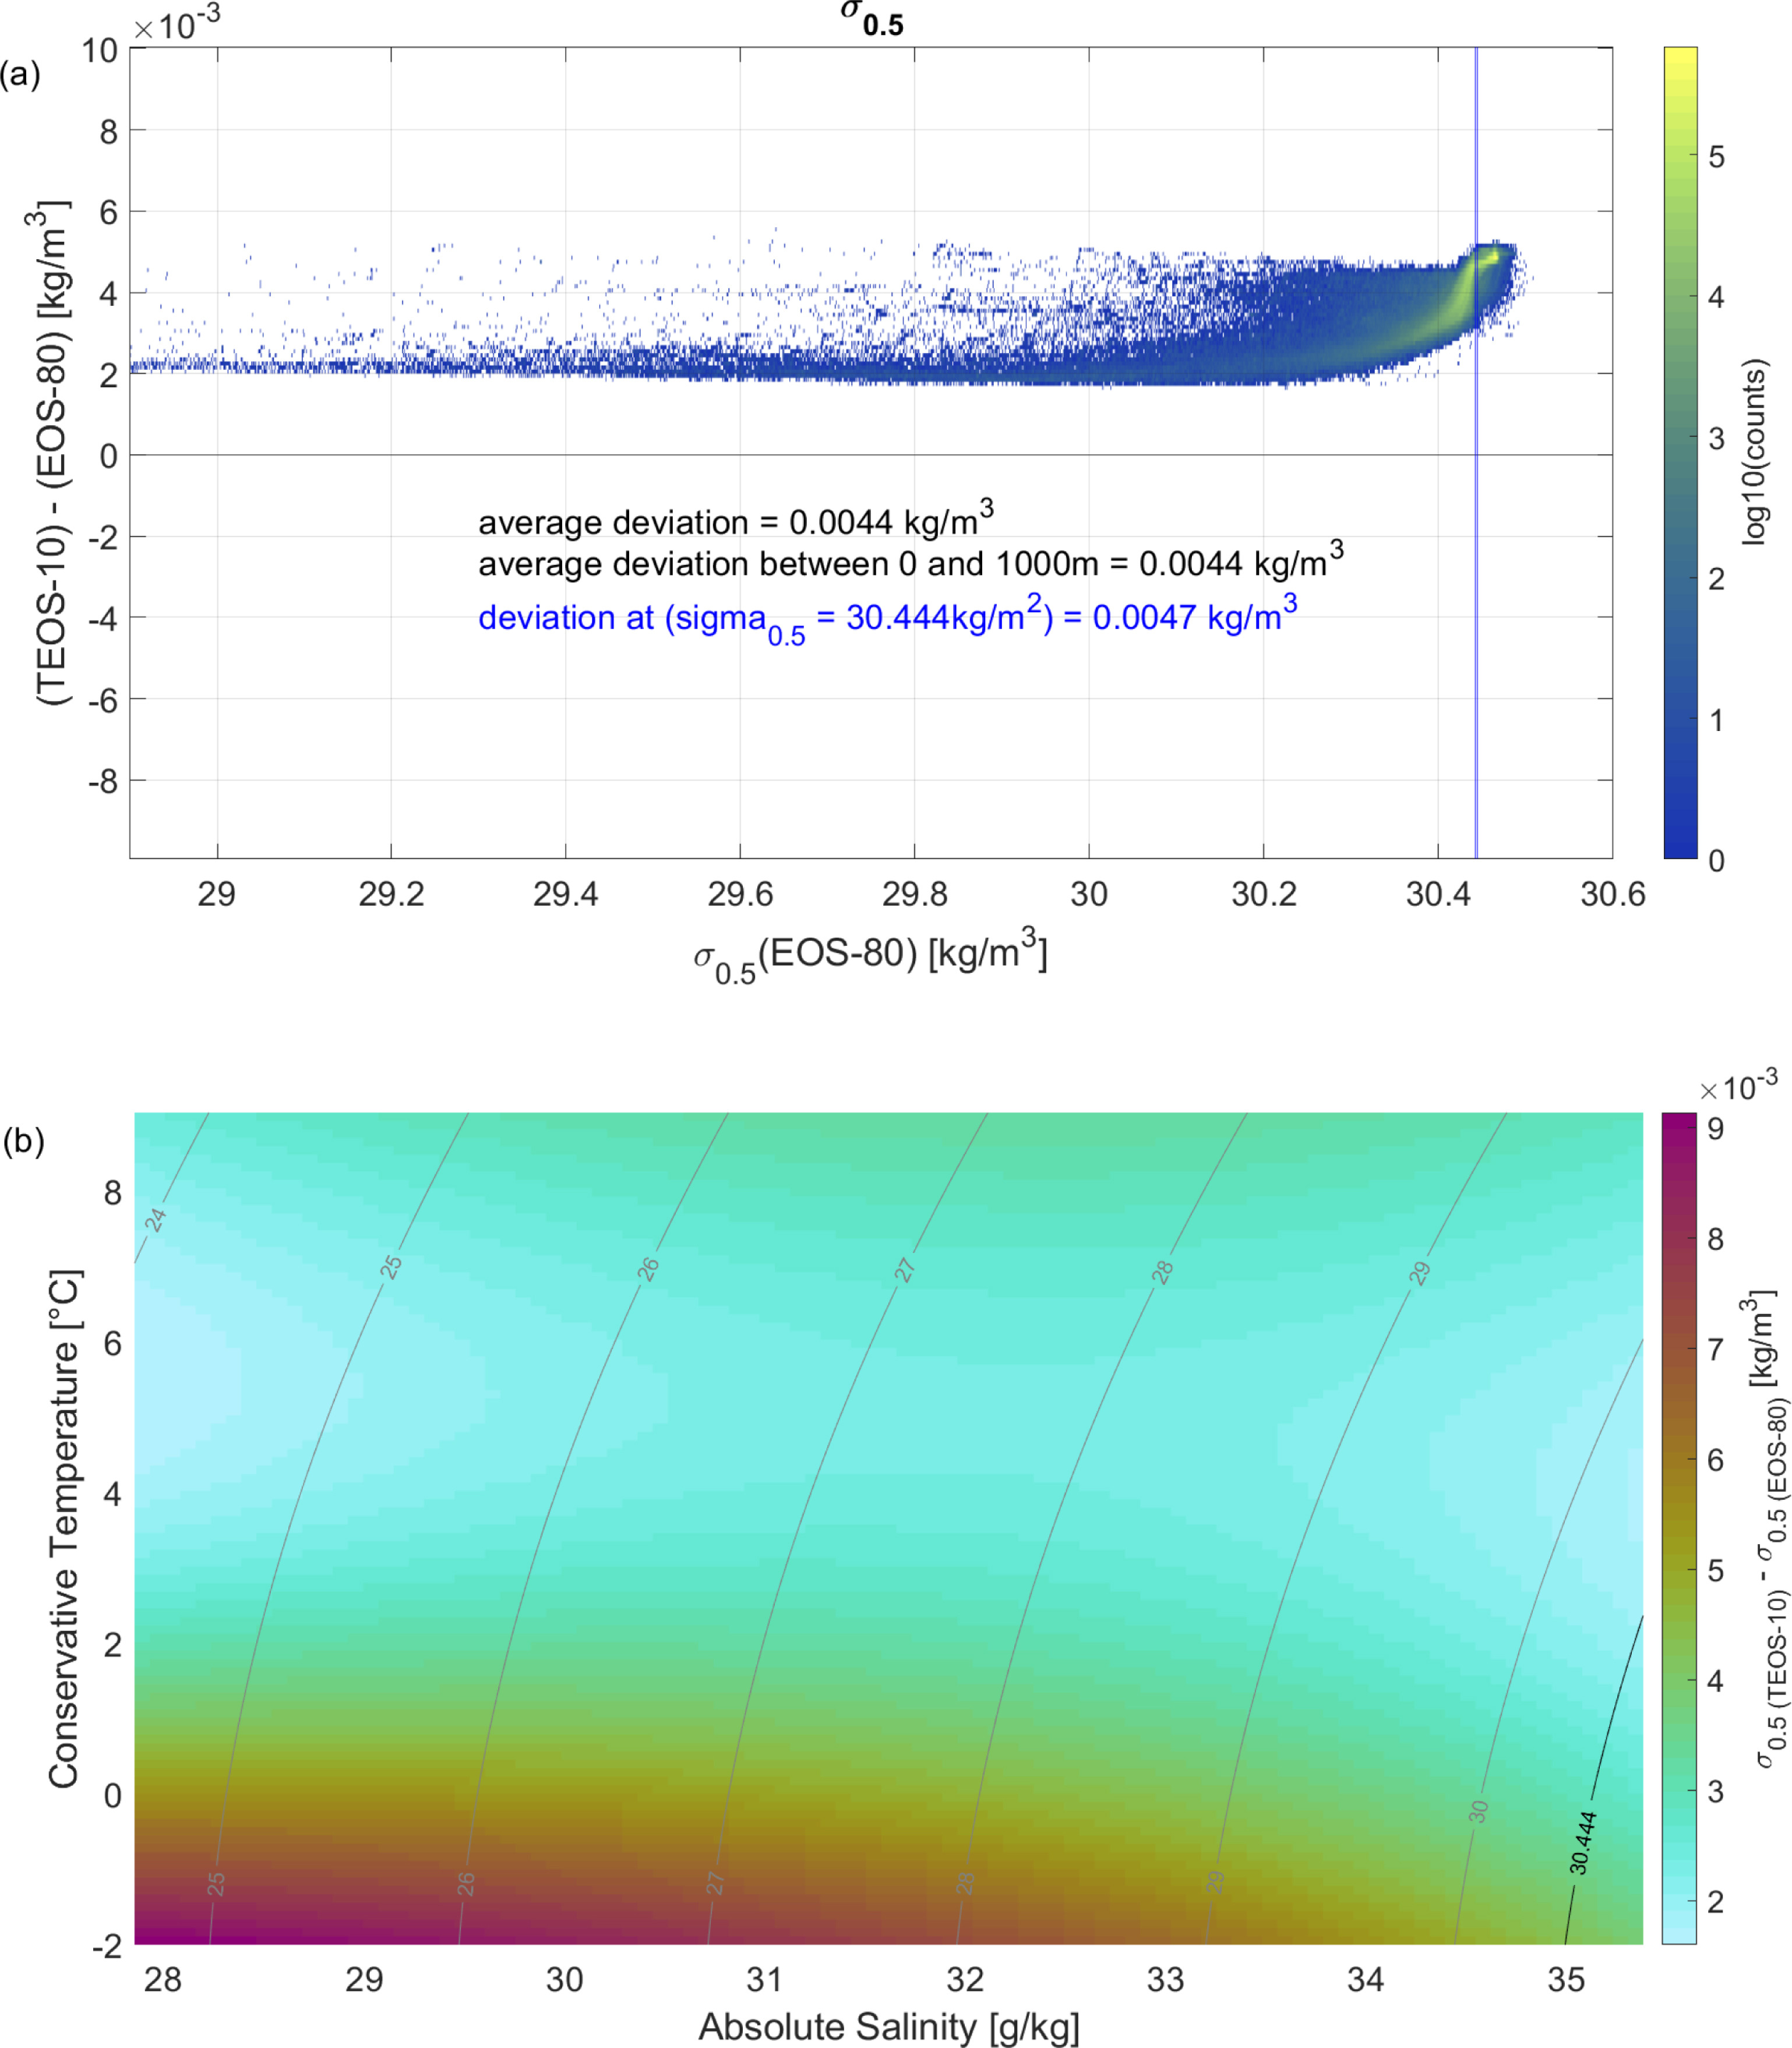
Fig. A.2.1. Density difference between the EOS-80 and TEOS-10 standards. (a) Difference between EOS-80 and TEOS-10 densities for the entire data set. (b) Difference between EOS-80 and TEOS-10...
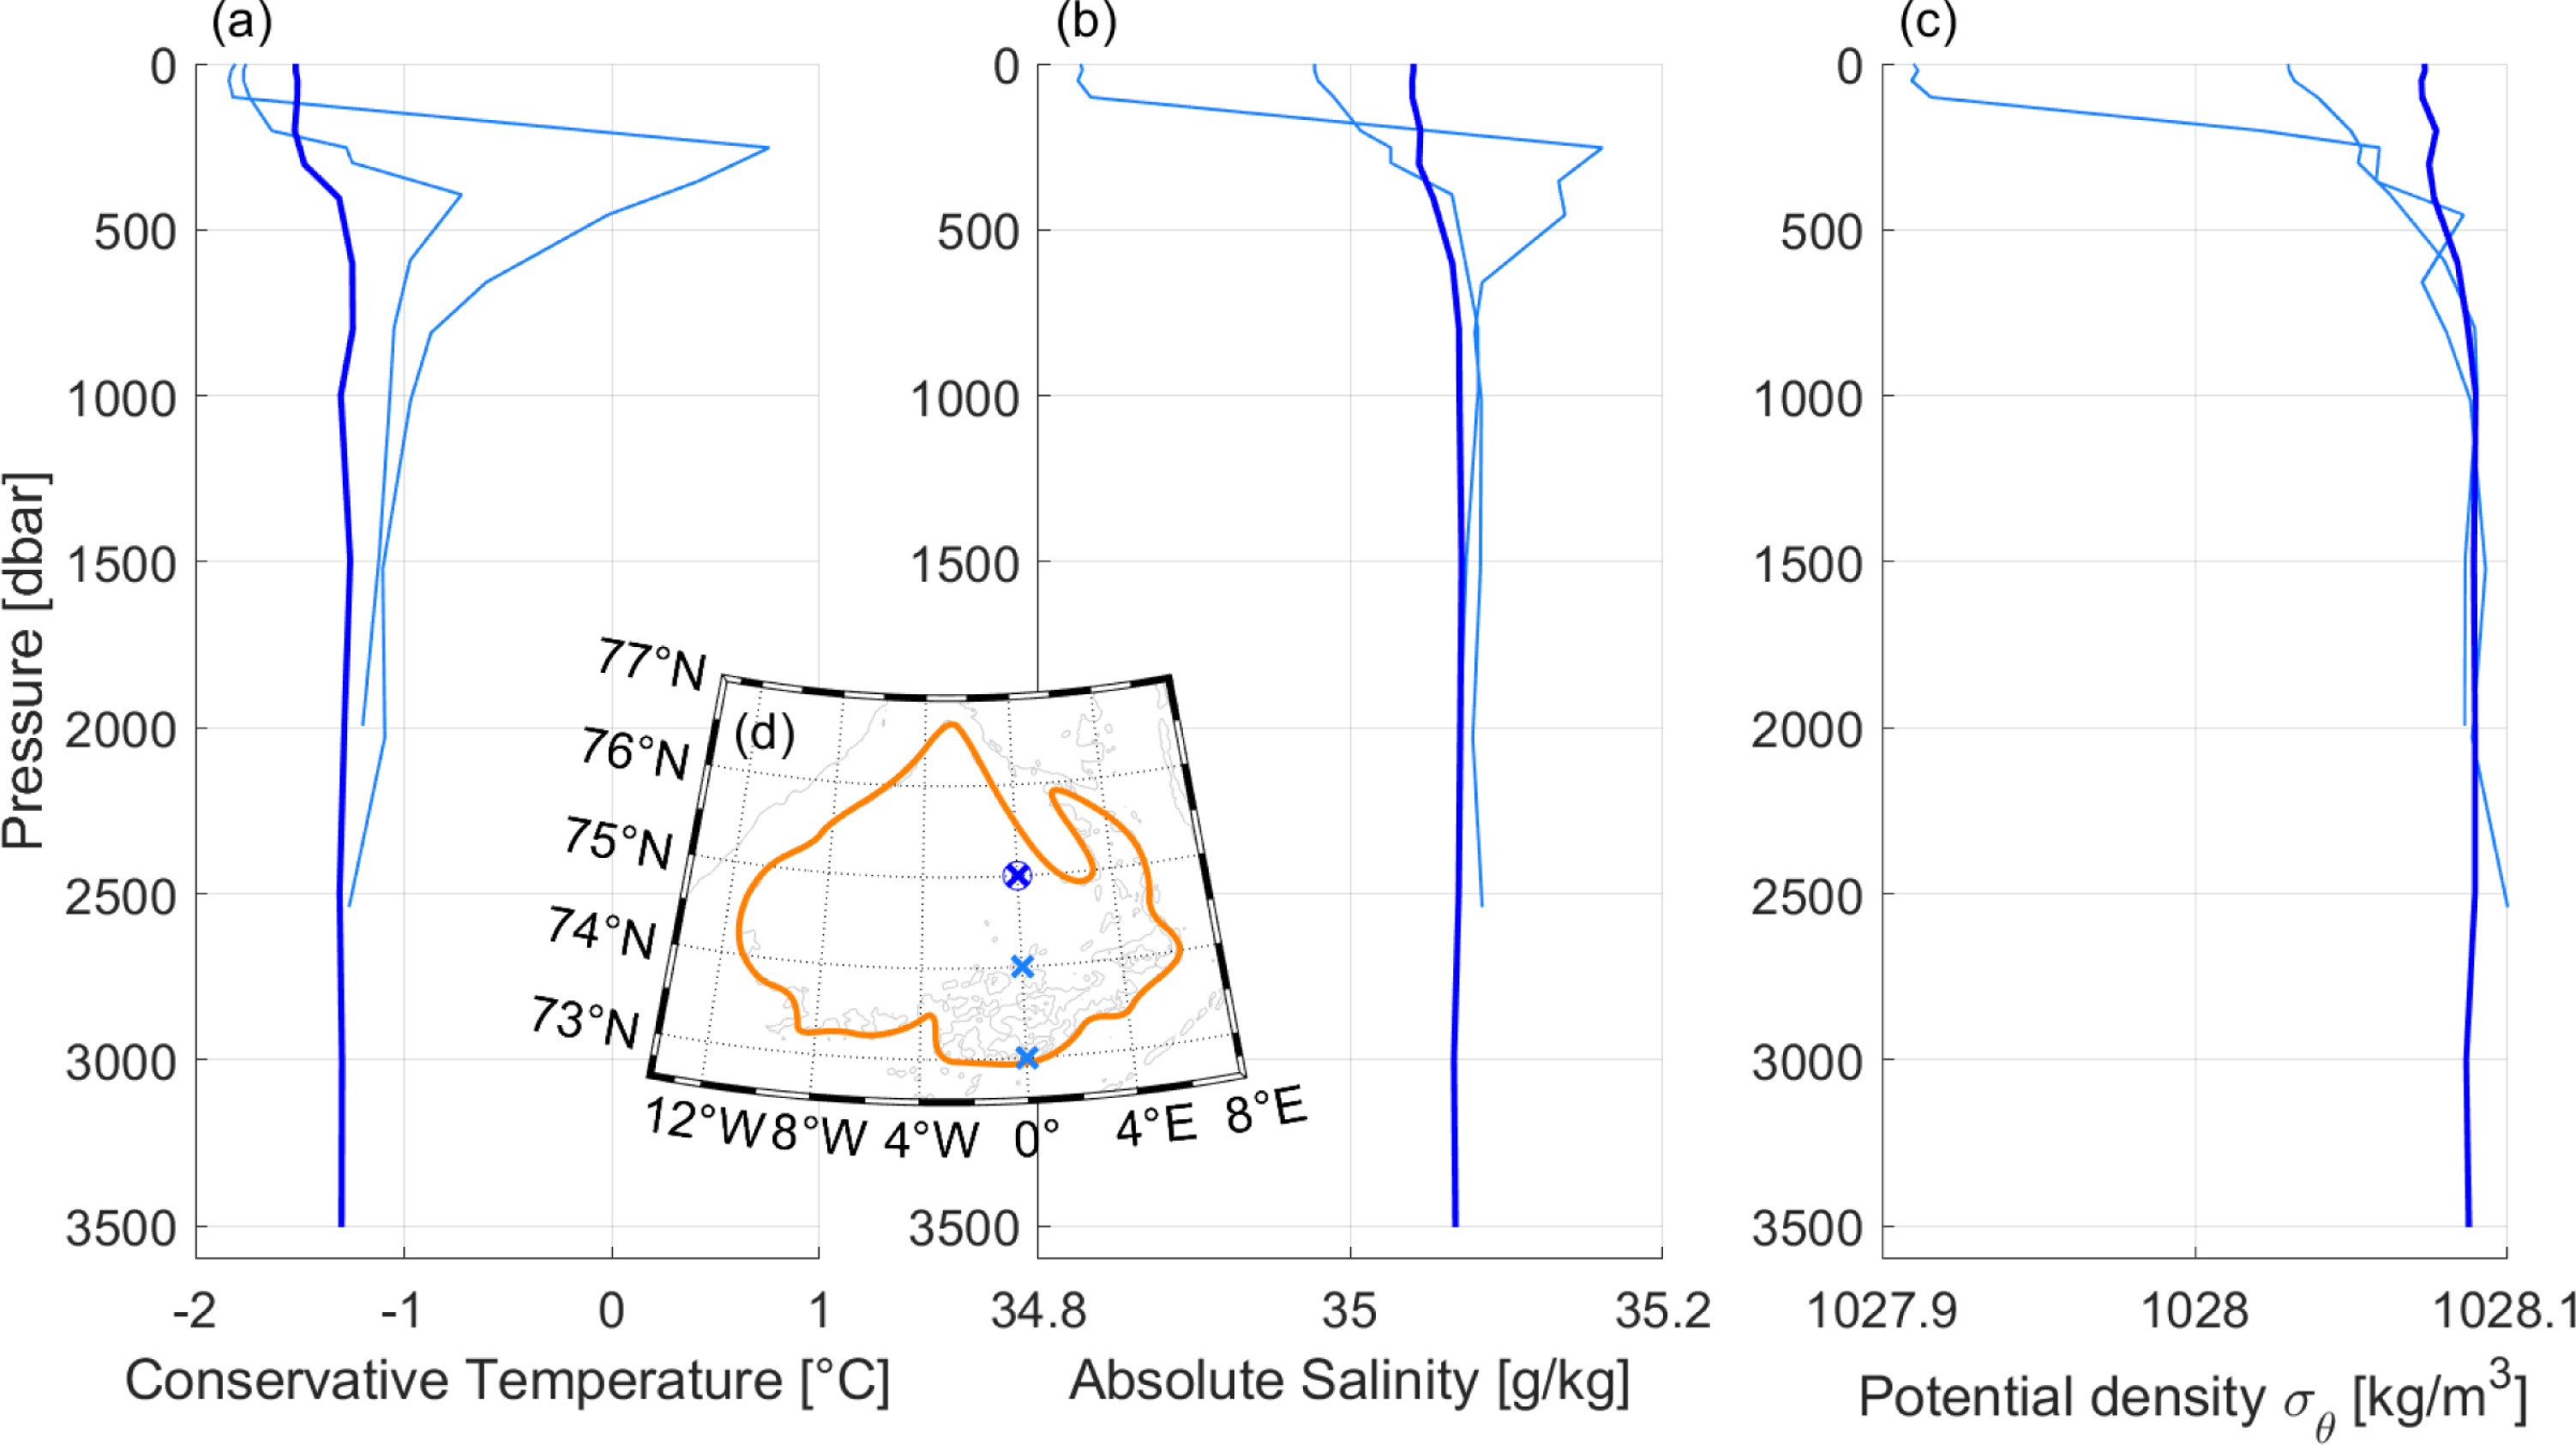
Fig. A.3.1. Profiles from the February 1971 cruise in the central Greenland Sea. The locations of the profiles are marked in the inset (d). The dark-blue profile is the so-called “Malmberg profile”...
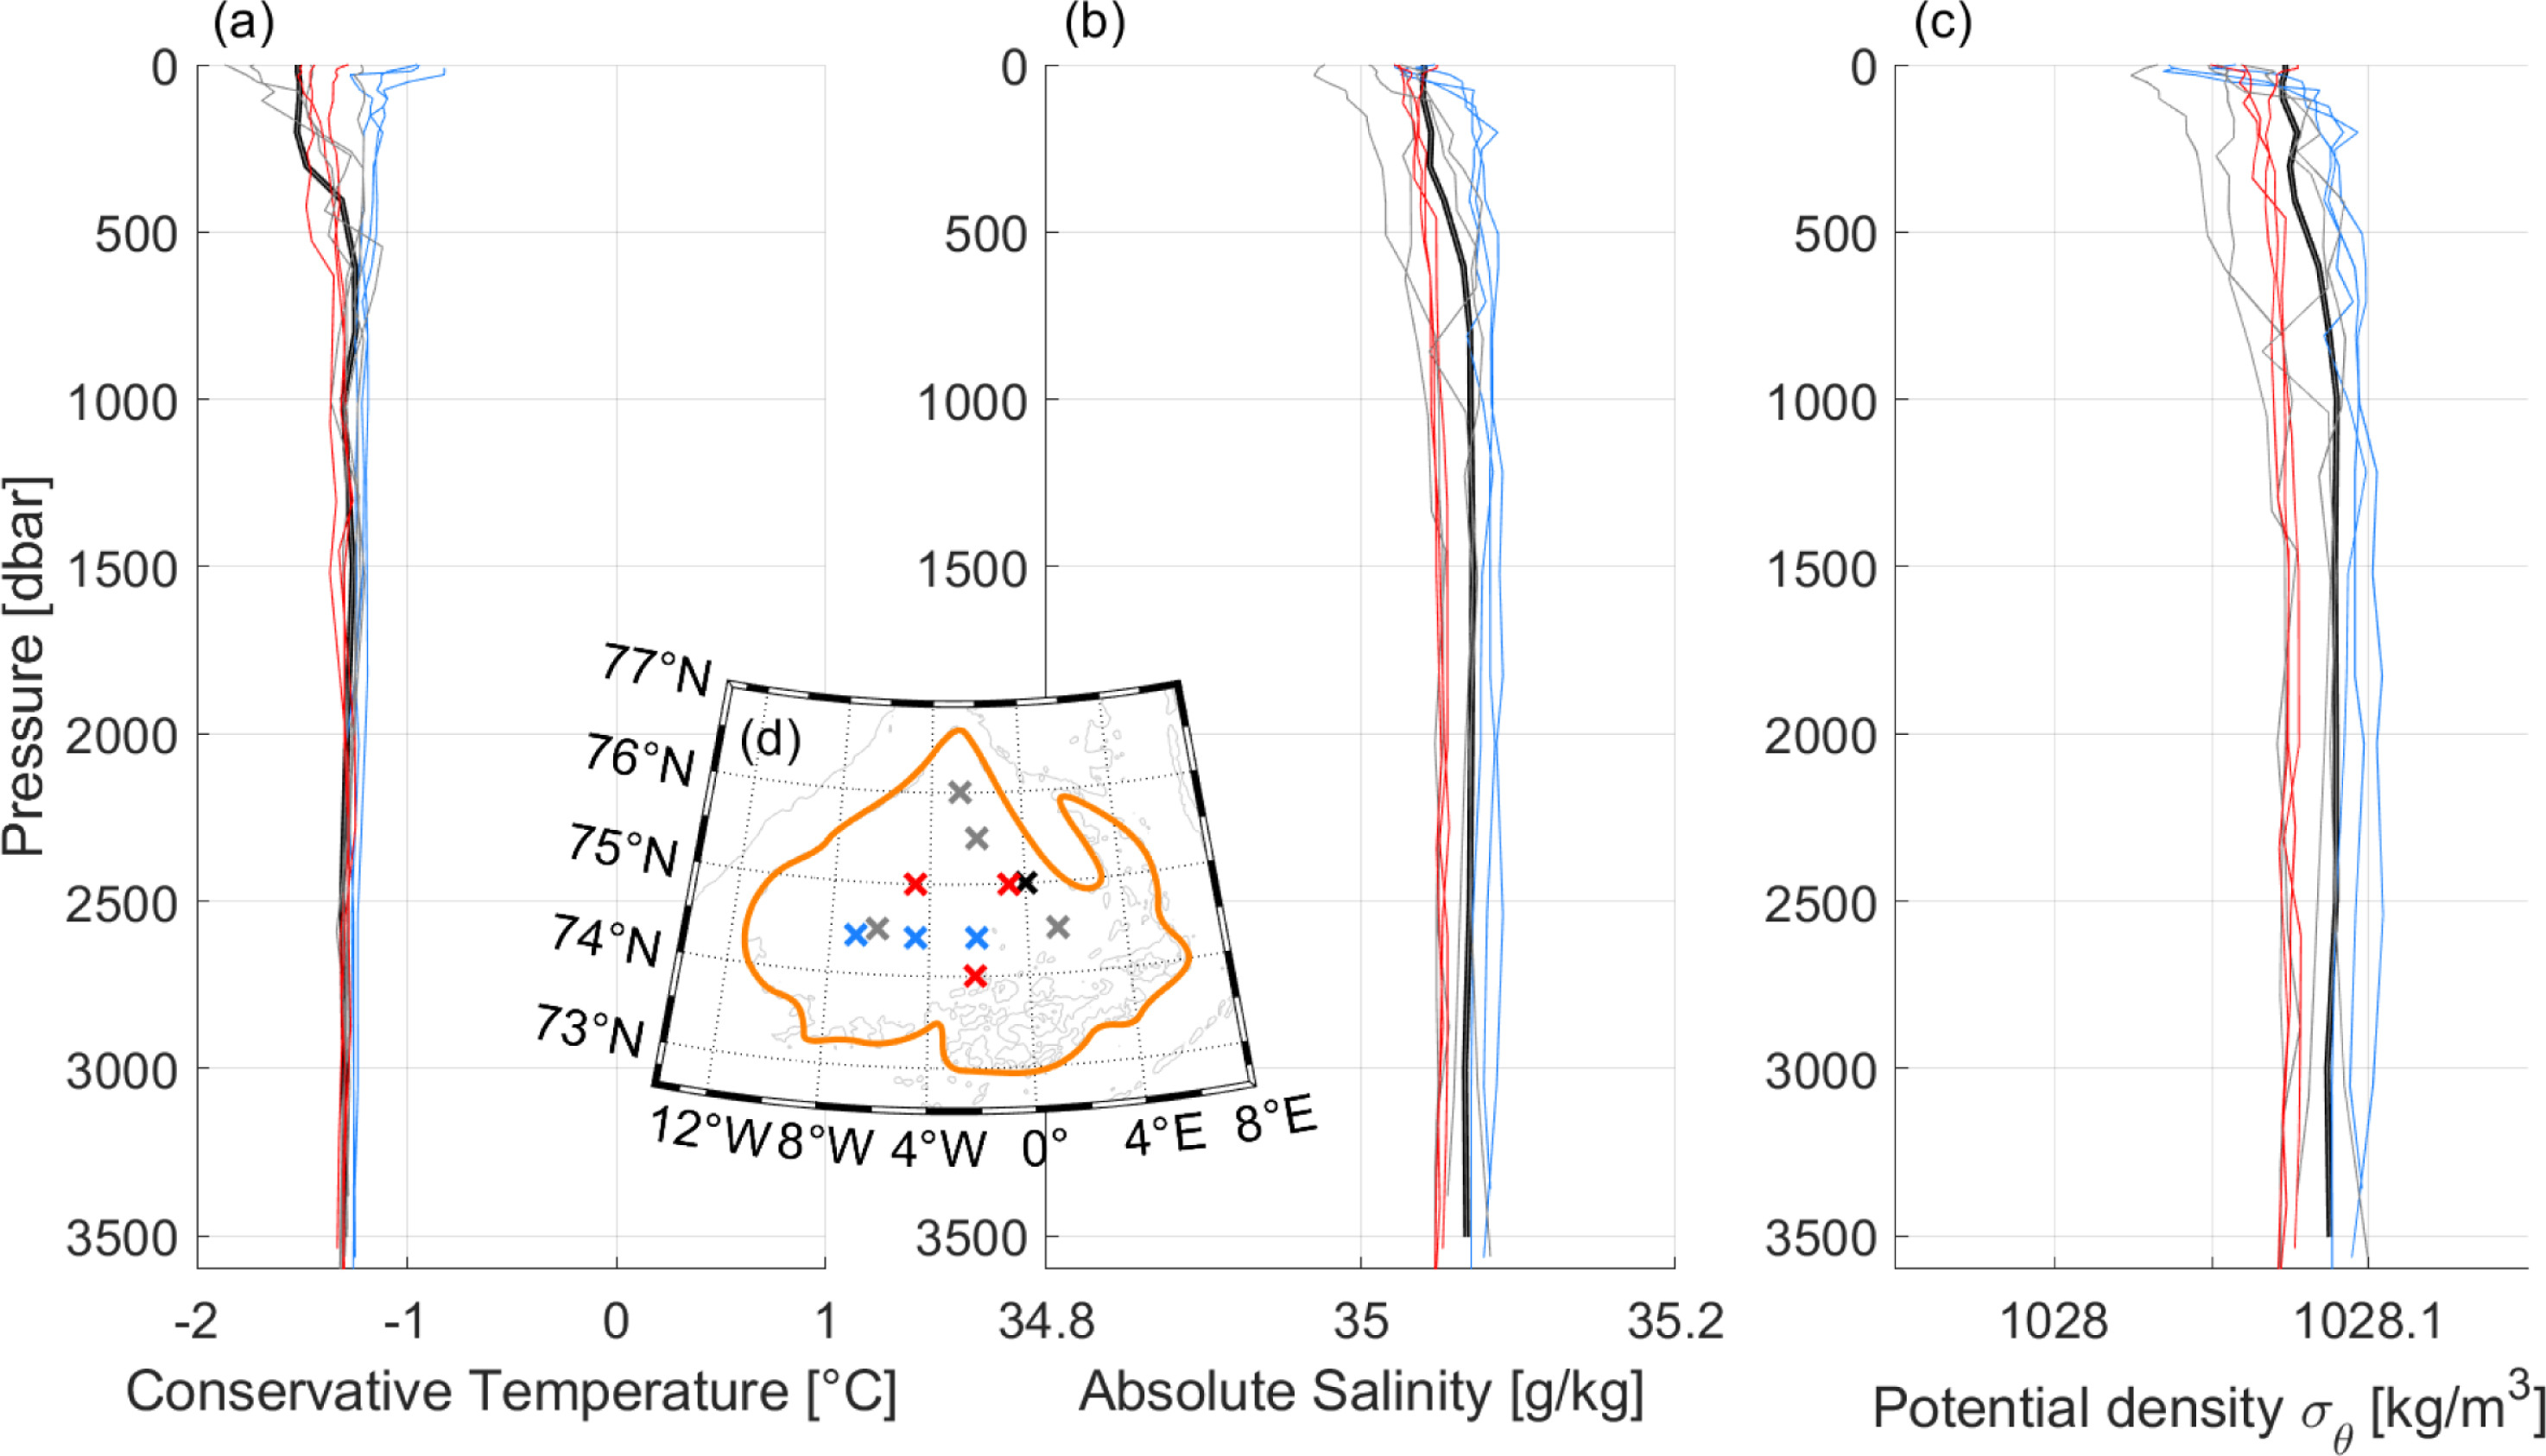
ig. A.3.2. Profiles indicating convection deeper than 3000 m identified by manual detection. The different colors and line widths were used to visualize the differences in degree of ...
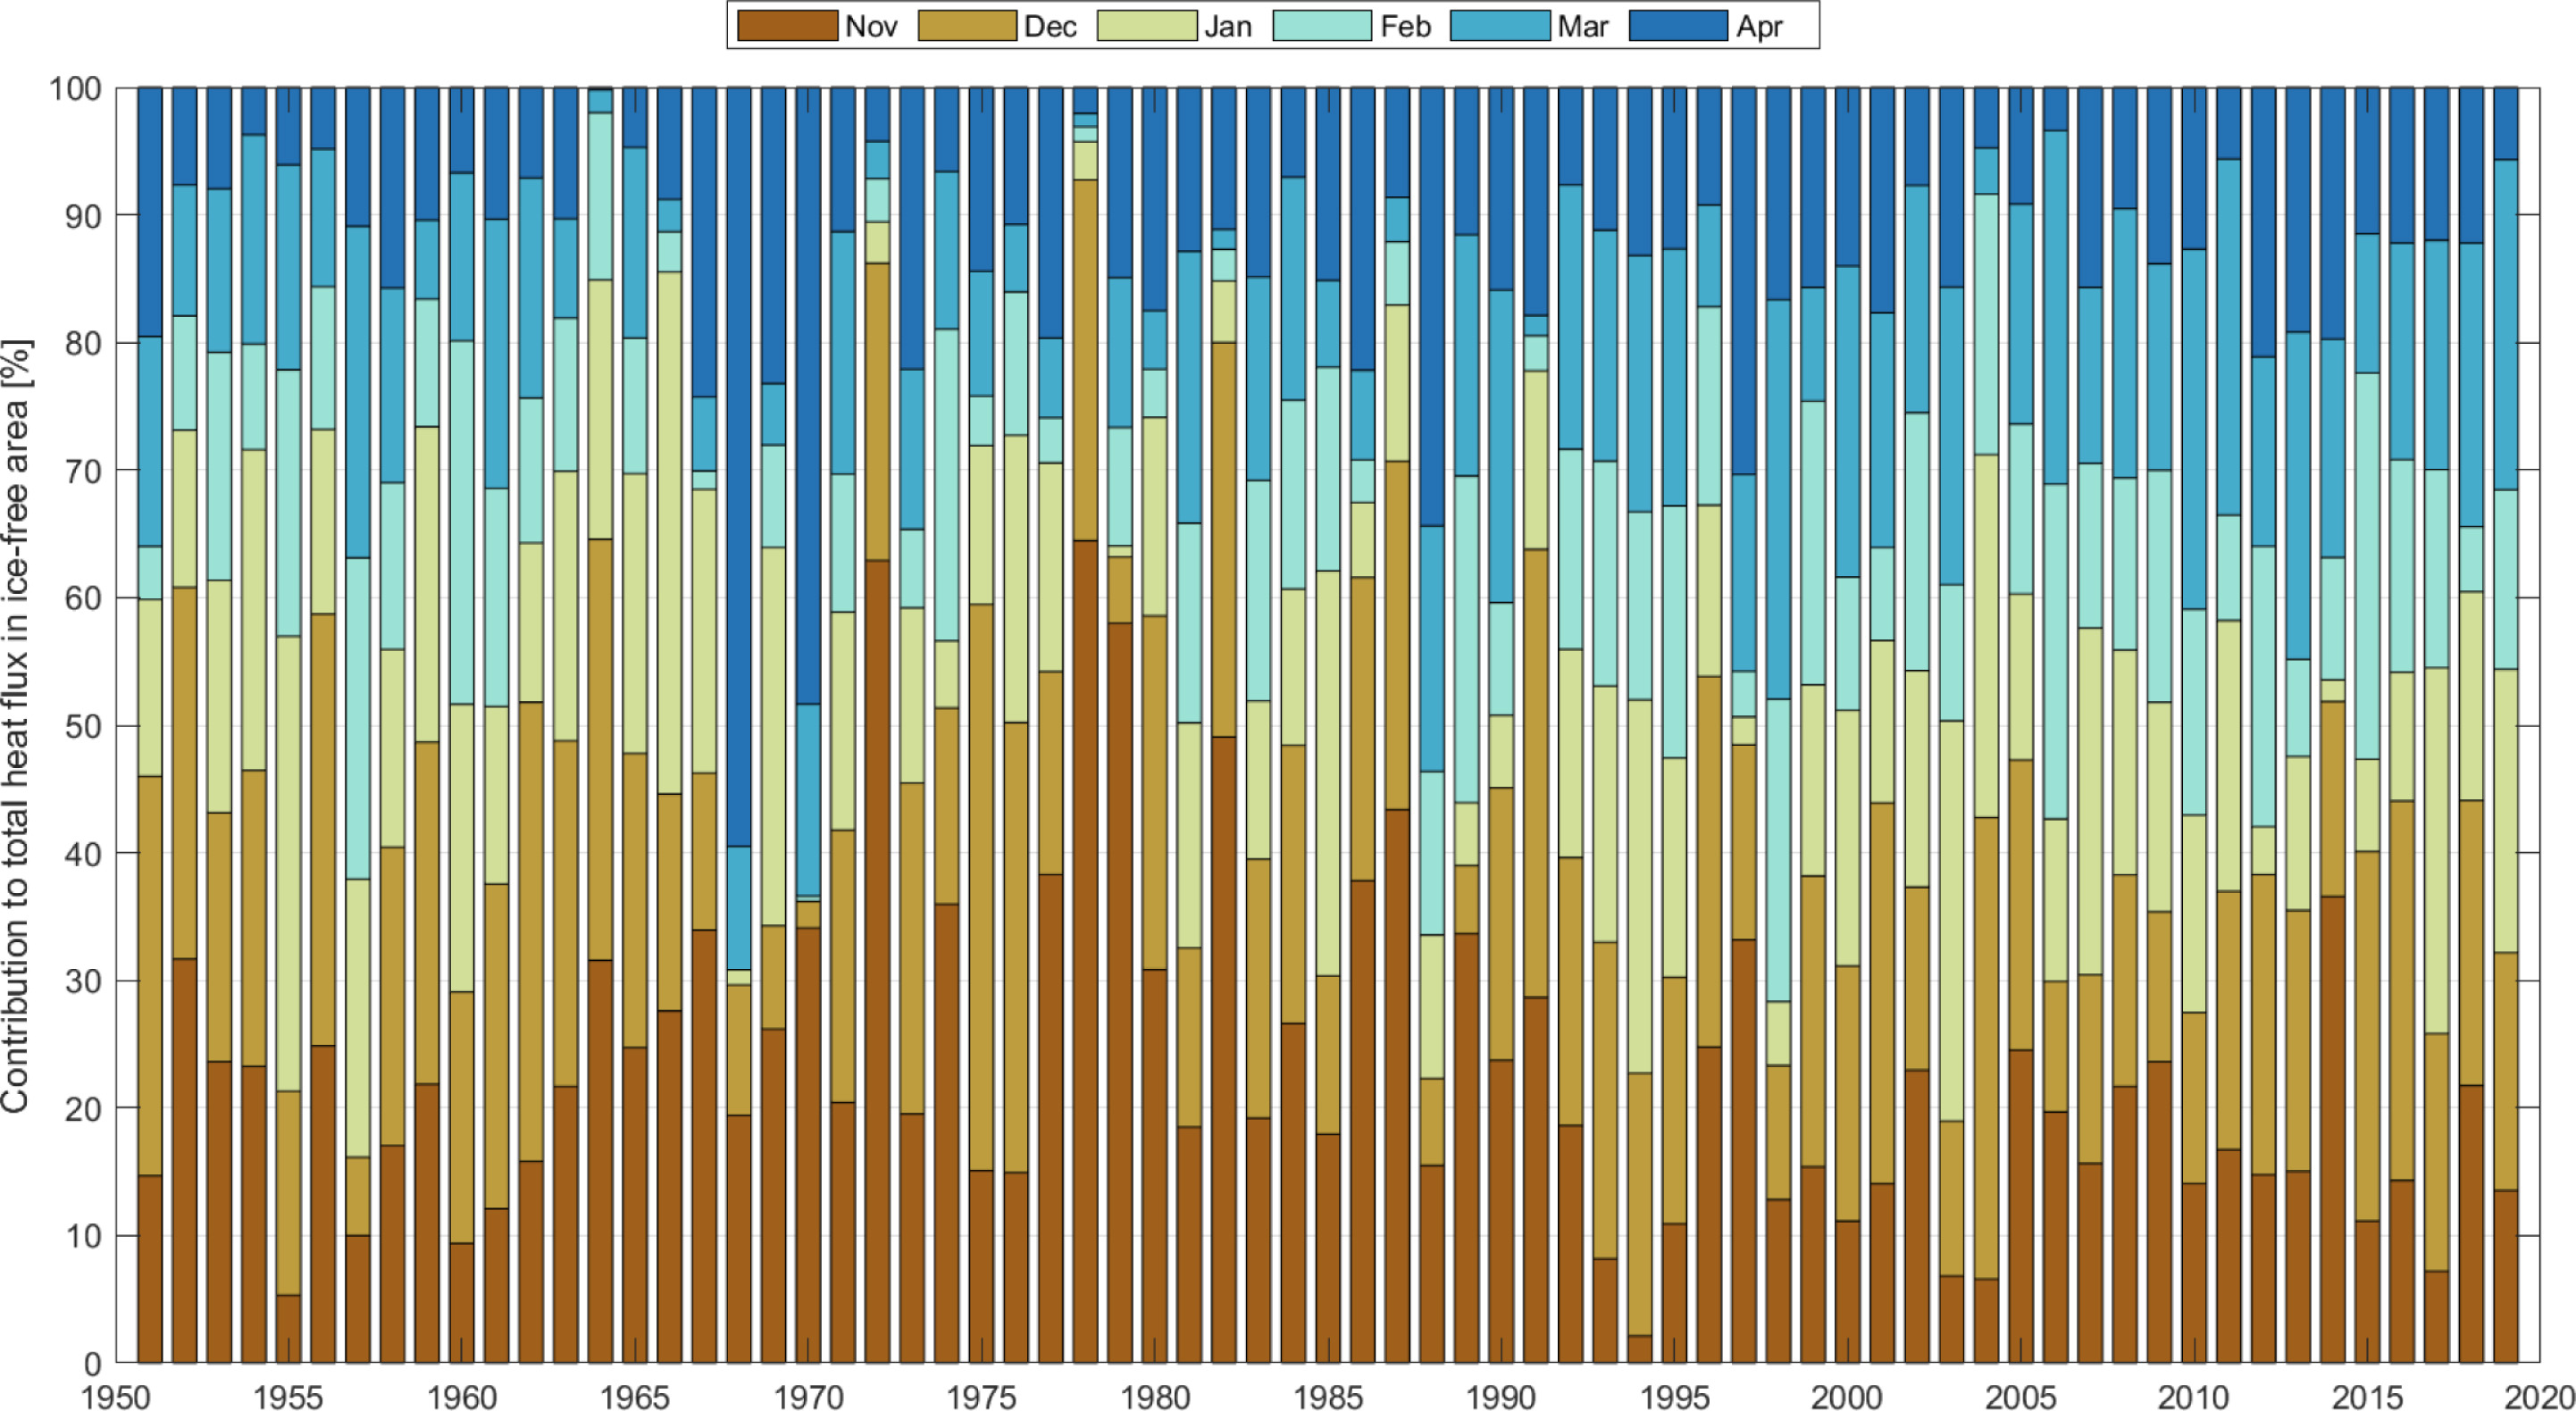
Fig. A.5.1. Stacked contributions from each winter month to the total winter heat loss. Only the ice-free portion of the Greenland Sea (sea-ice concentration ) was included in the calculation.
Fig. A.5.2. Characteristics of extreme heat-flux events. The dark-blue dots show the þ95 percentile of heat fluxes for each winter (November to April), the dark-blue linear regression line indicates .
Strehl Anna-Marie, Våge Kjetil, Smedsrud Lars H., Barreyre Thibaut (2024). A 70-year perspective on water-mass transformation in the Greenland Sea: From thermobaric to thermal convection. Progress in Oceanography. INPRESS. https://doi.org/10.1016/j.pocean.2024.103304, https://archimer.ifremer.fr/doc/00899/101124/
Copy this text
Related datasets
Argo (2024). Argo float data and metadata from Global Data Assembly Centre (Argo GDAC). SEANOE. https://doi.org/10.17882/42182