The ZooScan and the ZooCAM zooplankton imaging systems are intercomparable: A benchmark on the Bay of Biscay zooplankton
Zooplankton analysis represents a bottleneck in marine ecology studies due to the difficulty to obtain zooplankton data. The last decades have seen the intense development of zooplankton imaging systems, to increase the zooplankton data spatio-temporal resolution as well as enabling the combination of size, taxonomy, and functional traits in aquatic ecology studies. Here, we propose a benchmark between the ZooScan, a commercially available, laboratory-based scanner, which analyses zooplankton preserved samples, and the ZooCAM, an in-flow imaging system designed for on-board live zooplankton imaging. Sixty-one zooplankton samples collected over the Bay of Biscay in environments ranging from estuarine to offshore blue waters were imaged with both instruments. Zooplankton Normalized Biovolume-Size Spectra slopes, mean sizes, abundances, and zooplankton community biogeographical patterns were computed for each instrument and compared at the taxonomic group, the sampling stations and the Bay of Biscay scales. Both instruments produced similar zooplankton variables by stations and by taxa and described similar zooplankton community compositions and biogeographical patterns, on the large mesozooplankton size range, i.e., [0.3–3.39] mm ESD. We conclude that the ZooCAM and the ZooScan data can be combined to generate long term or spatially resolved zooplankton time series. Our study shows that benchmarking imaging instruments or techniques (1) offers a robust assessment of interoperability between instruments, mitigating possible instrumental biases, and (2) may be of great interest in the case of instrumental obsolescence or breakdown, to choose the most conservative replacement solution in a long term time series framework
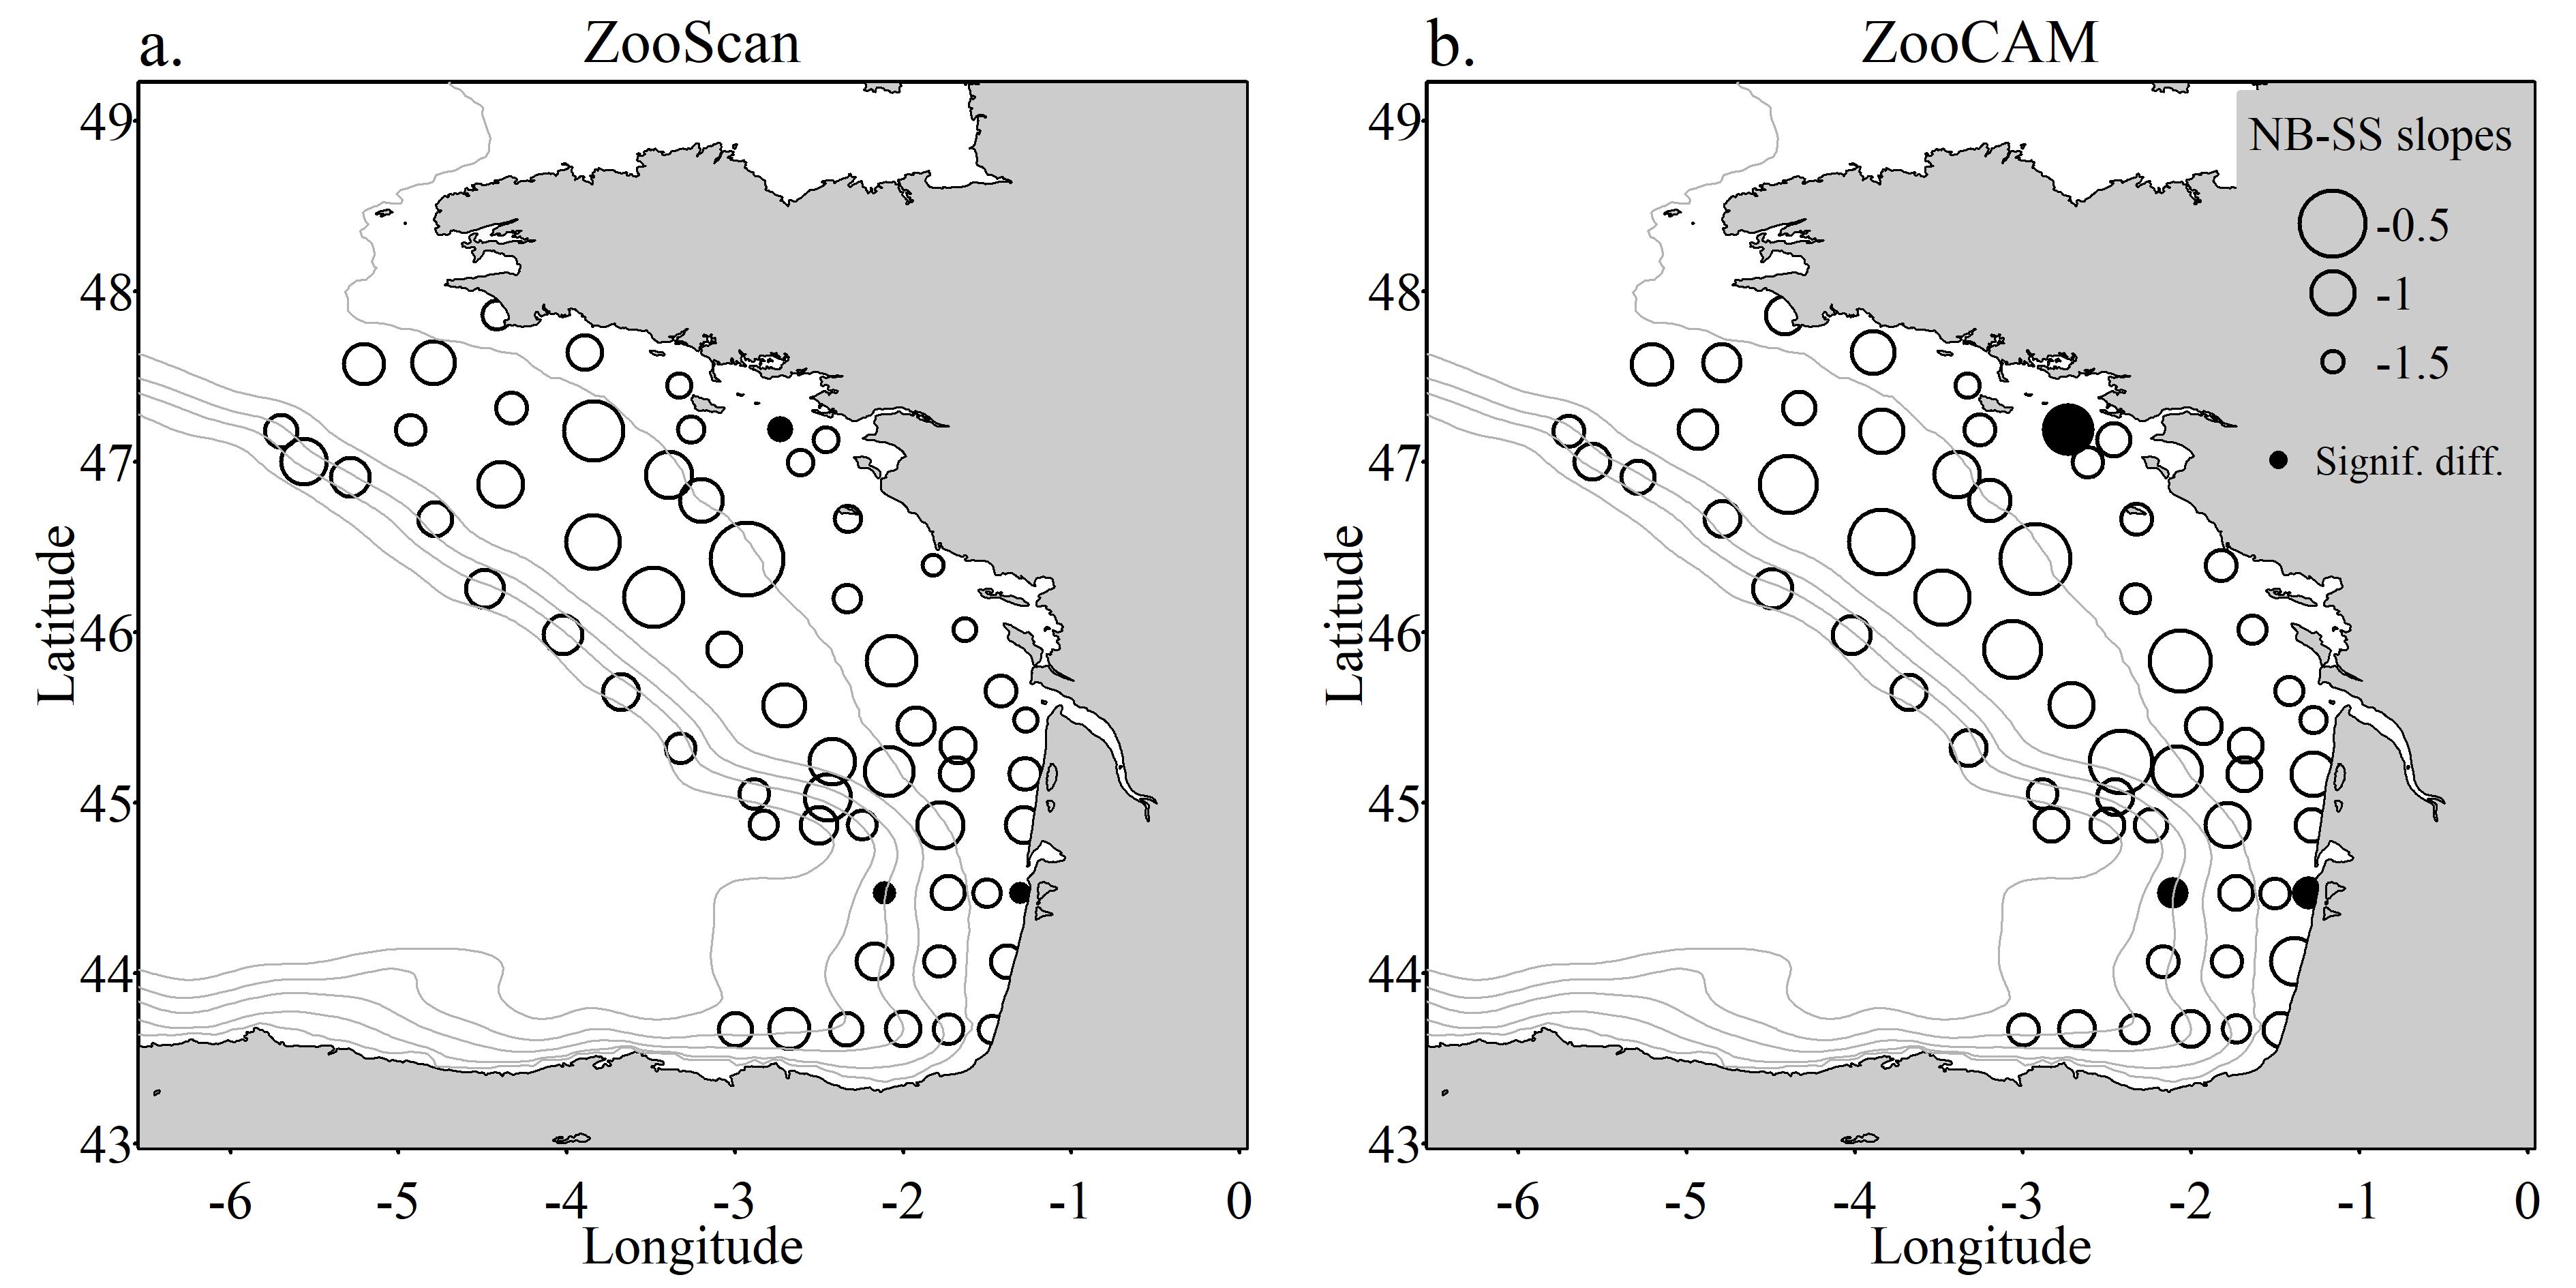
Figure S1. Maps of the NB-SS slopes calculated by stations from (a) the ZooScan data and (b) the ZooCAM data, in the [0.3–3.39] mm ESD size range. Open symbols: stations for which NB-SS slopes were ..
Figure S2. Boxplots of the ratios computed to detect stations for which values were significantly different between the ZooScan and the ZooCAM data. Outliers indicate stations with an abnormally ...
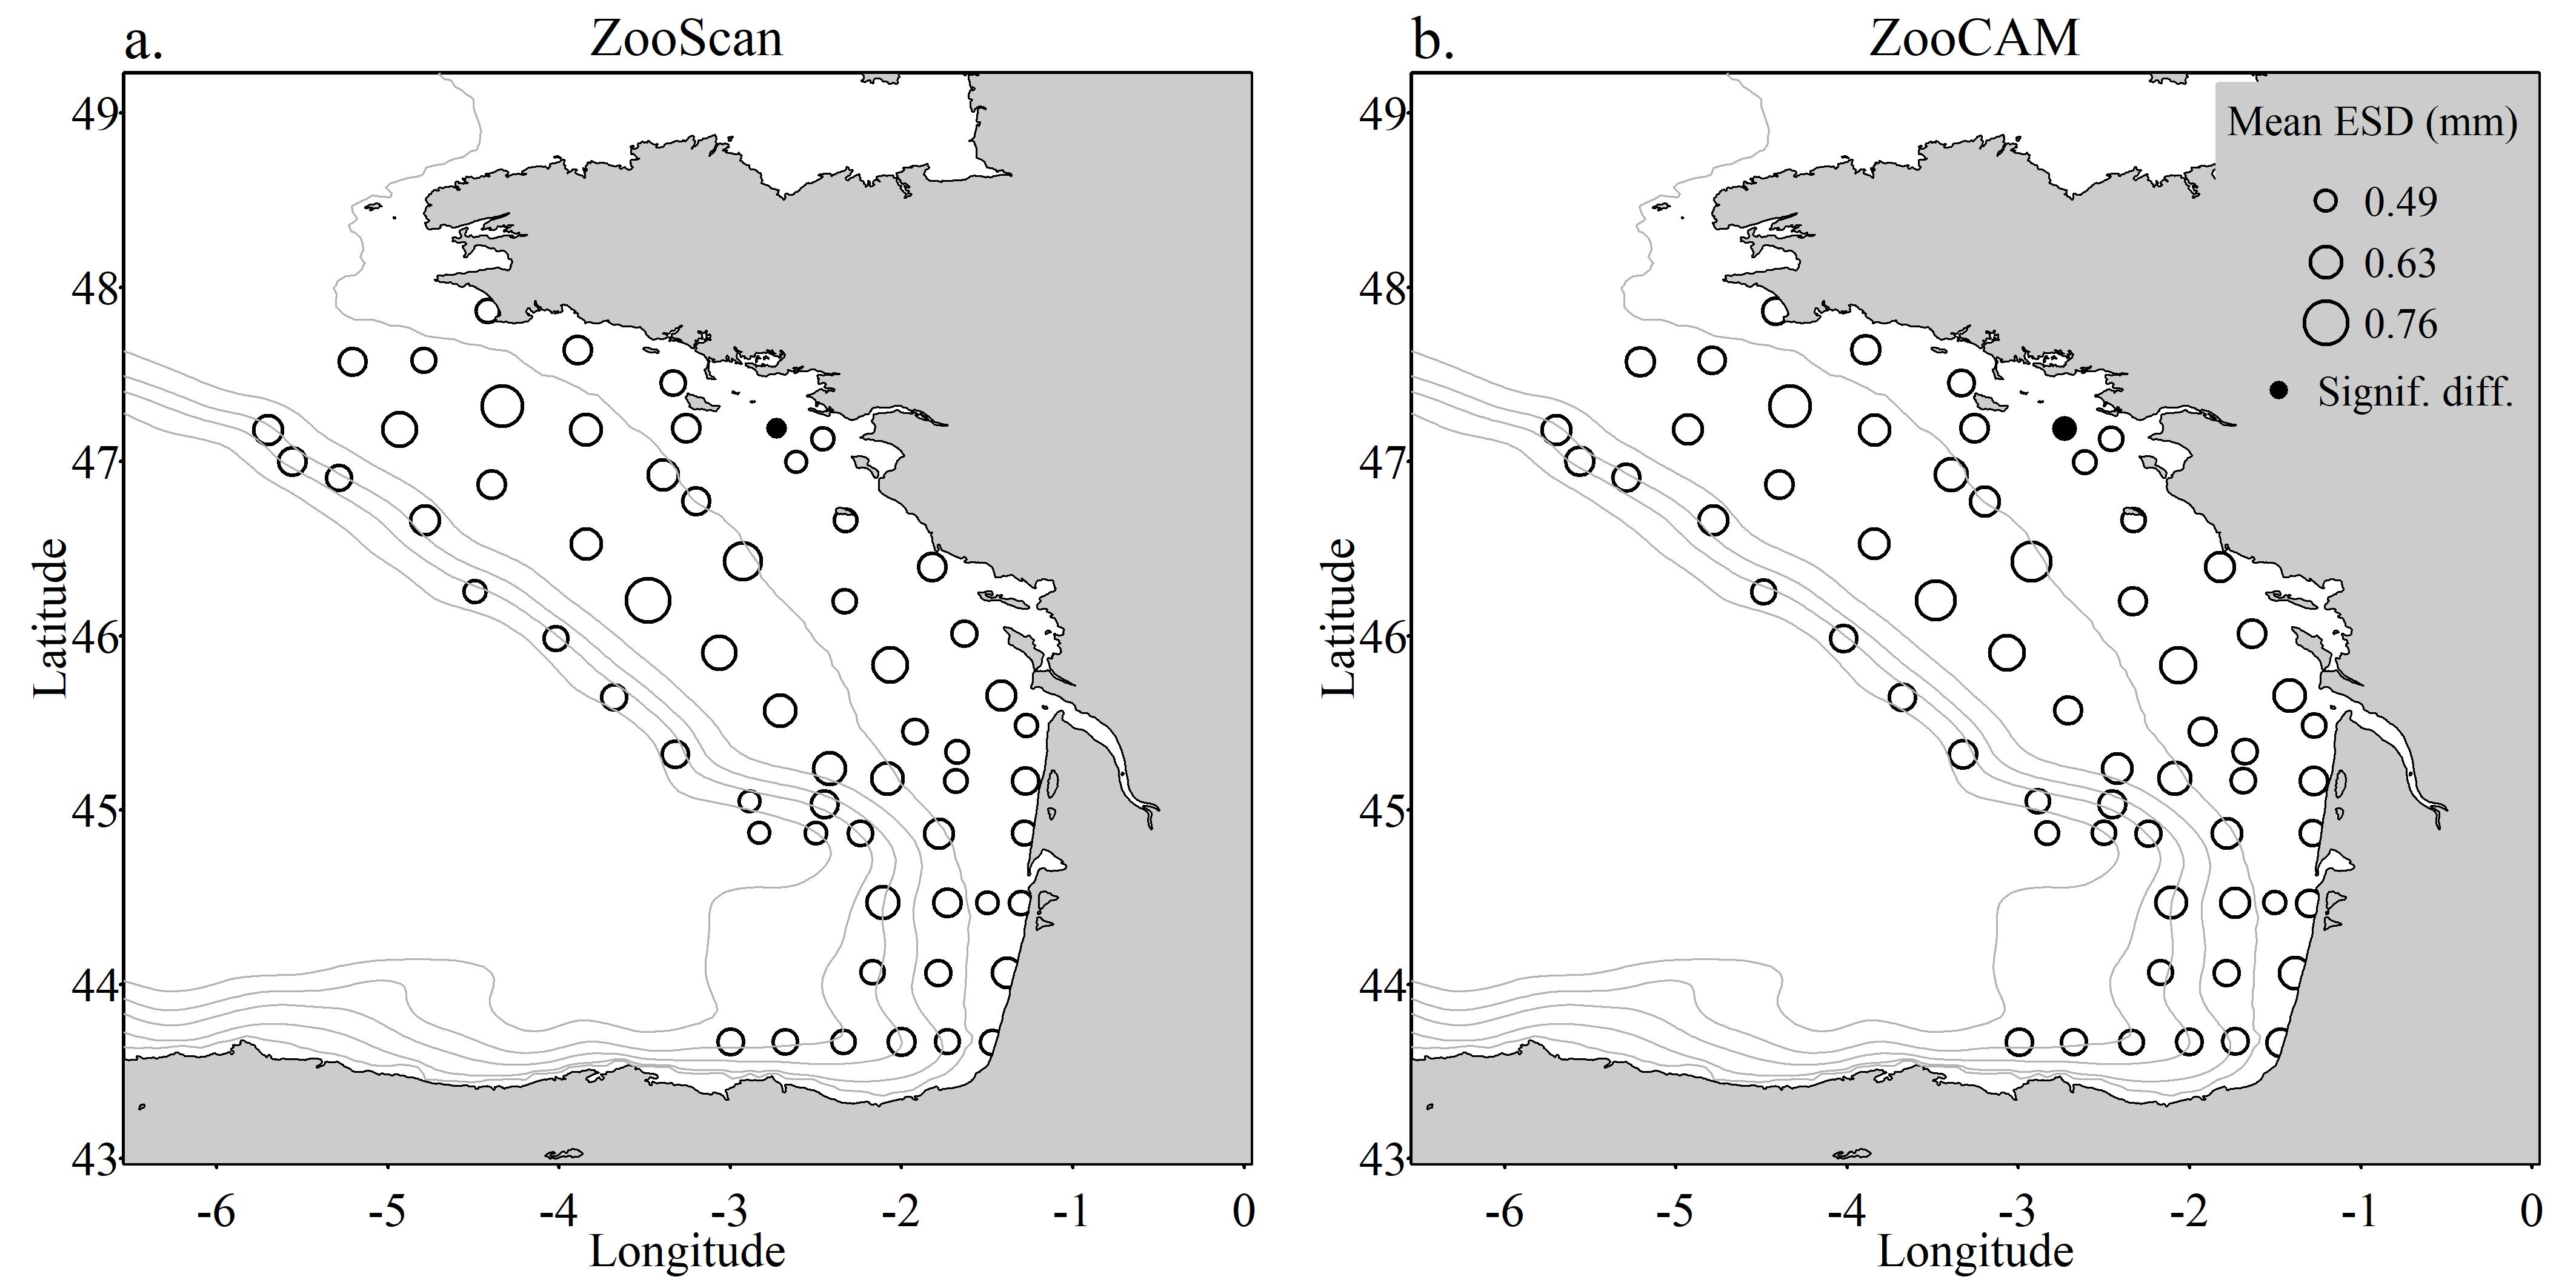
Figure S4. Maps of the mean sizes as Equivalent Spherical Diameter (mm) calculated by stations from (a) the ZooScan data and (b) the ZooCAM data, in the [0.3–3.39] mm ESD size range. Open symbols:...
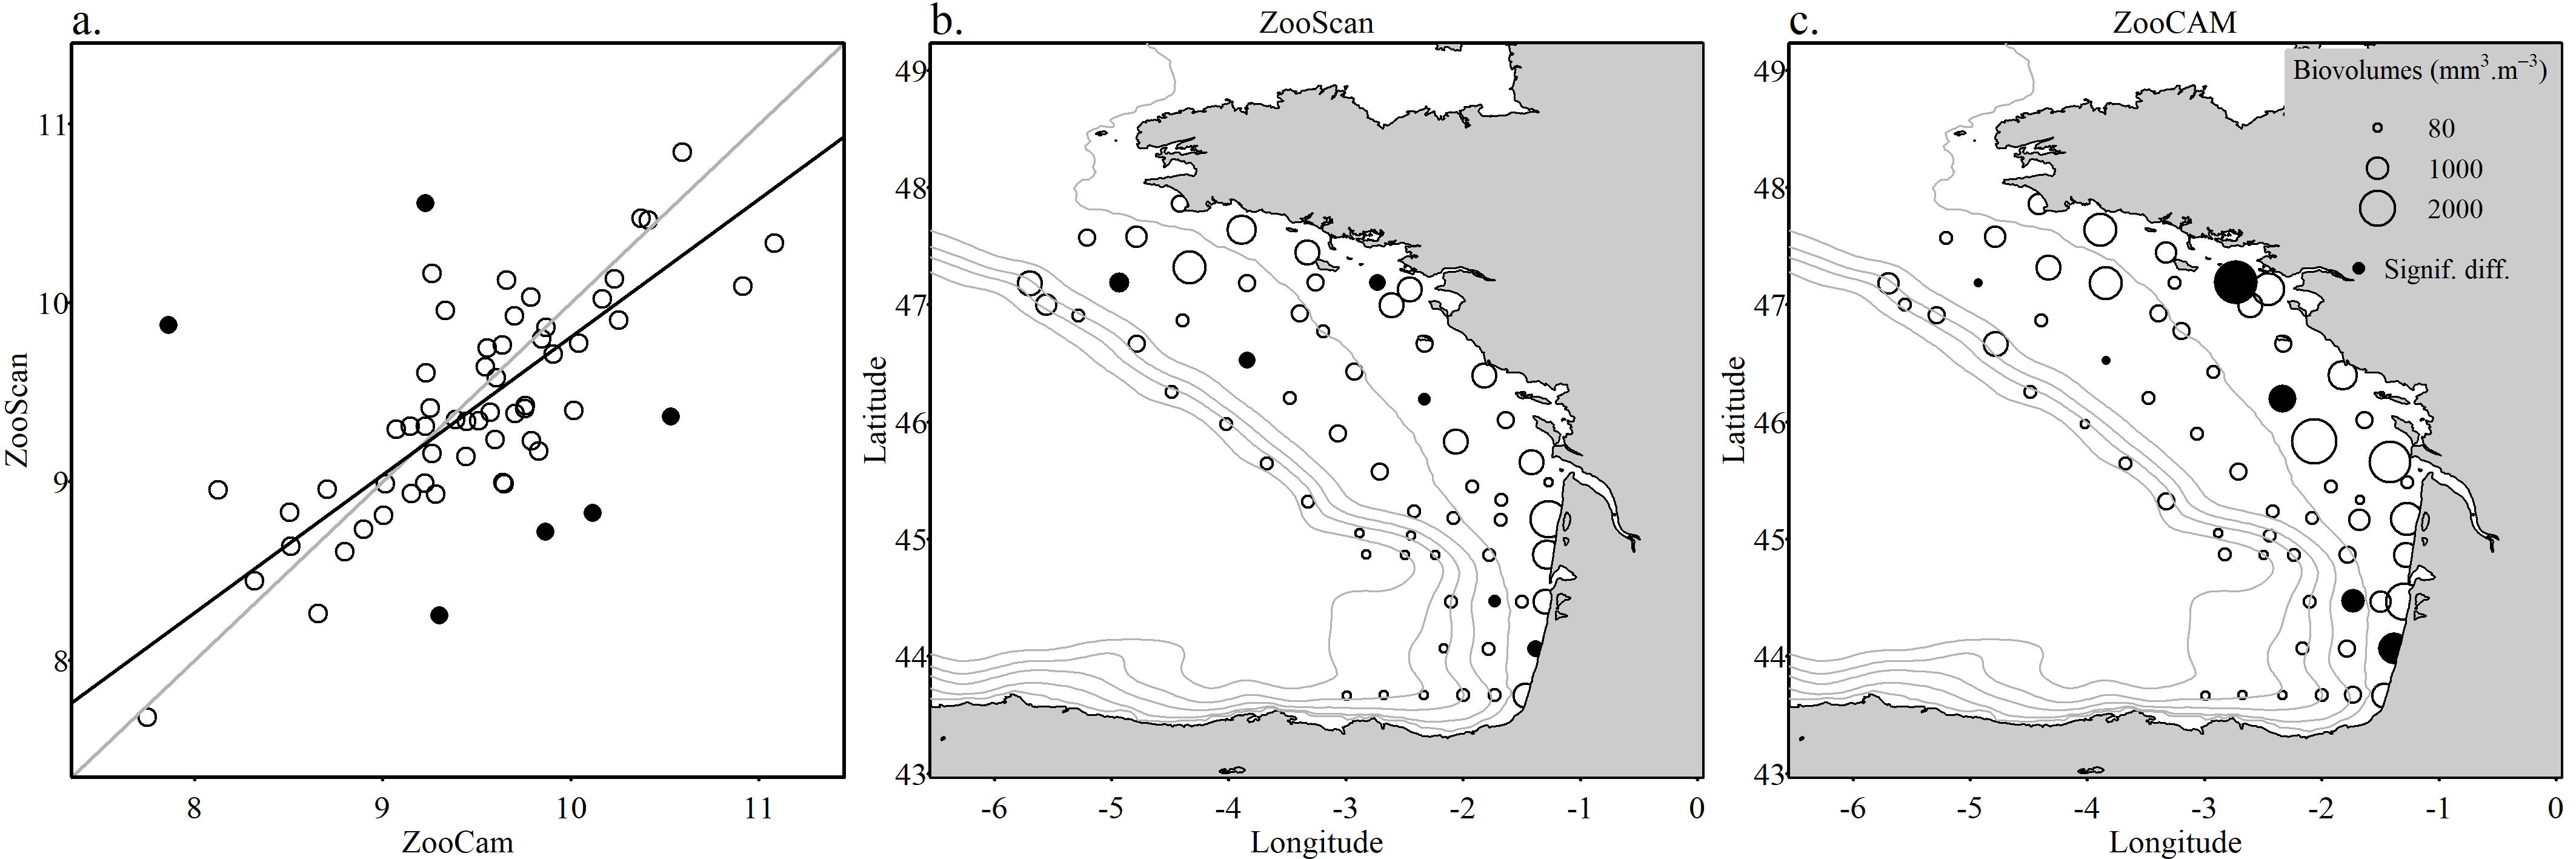
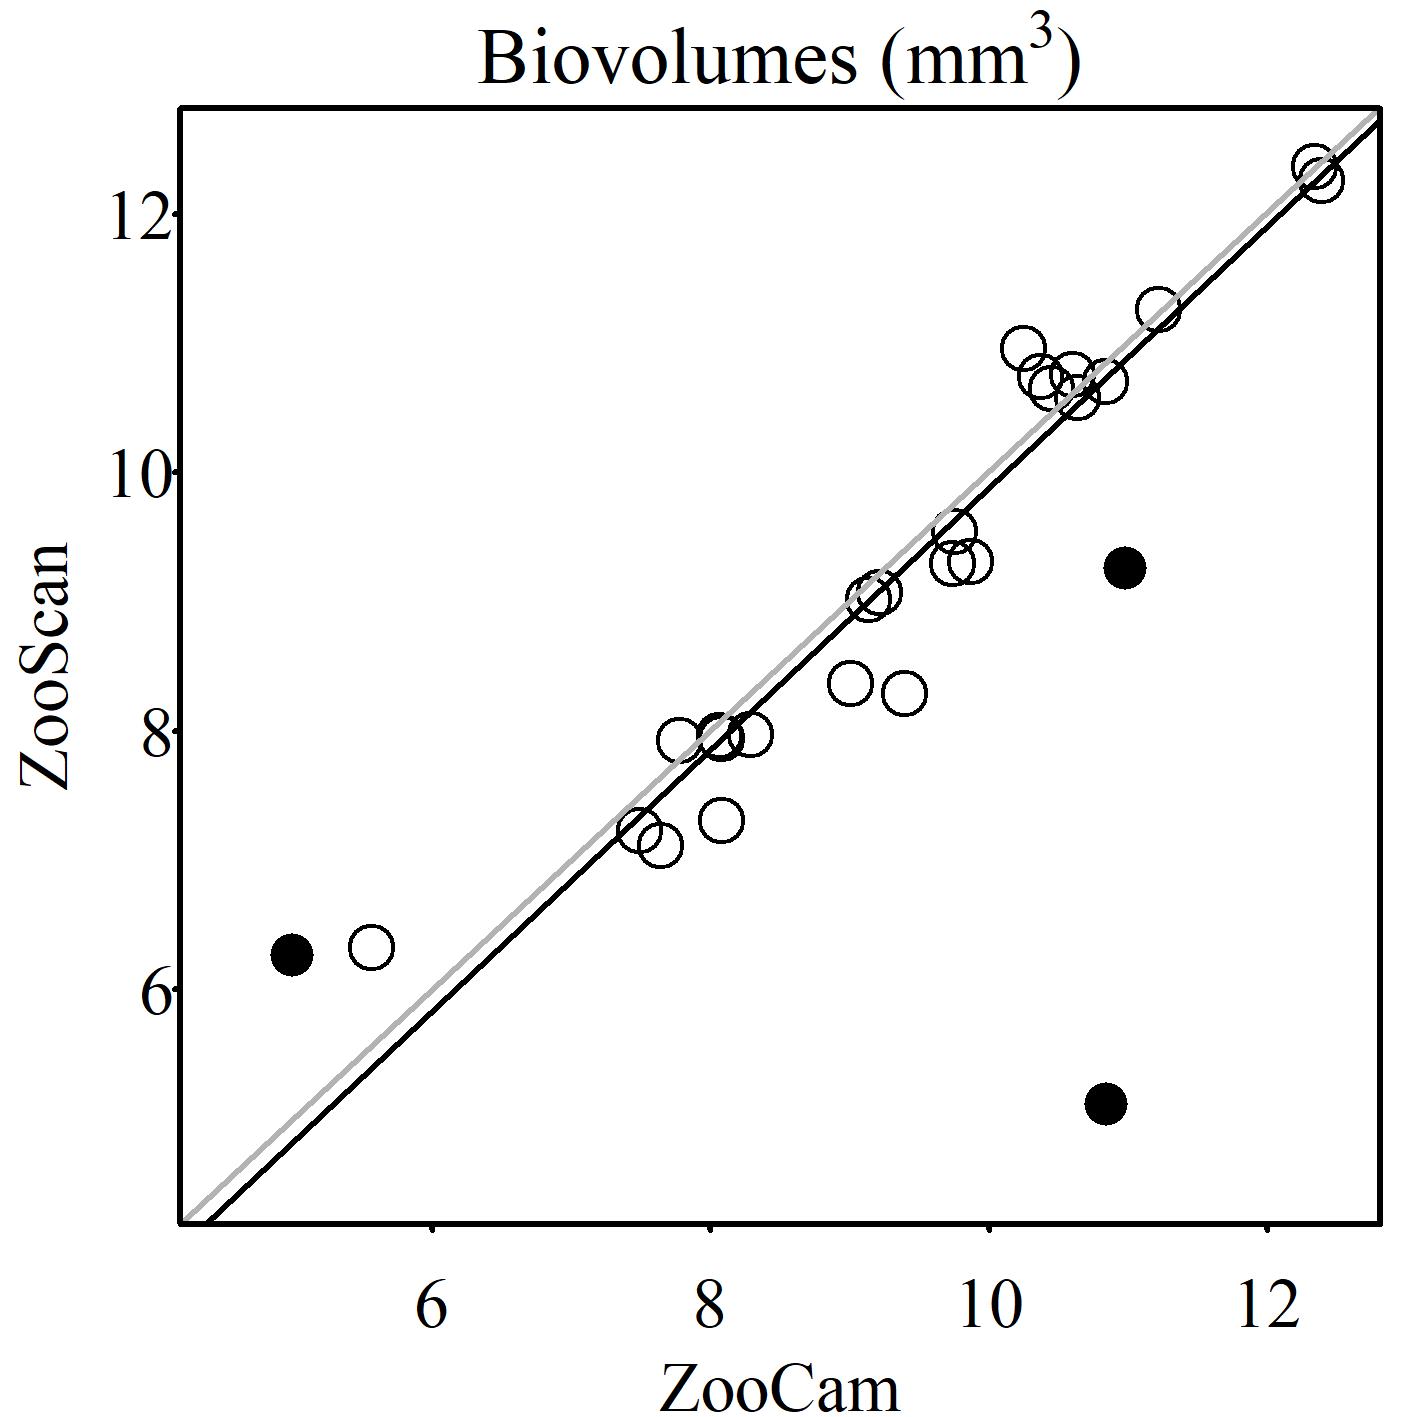
Figure S6. (a) Total biovolumes (mm3) calculated for the 61 sampling stations with the ZooScan (y-axis) and the ZooCAM (x-axis). The gray line represent y = x. The black line show the linear ...
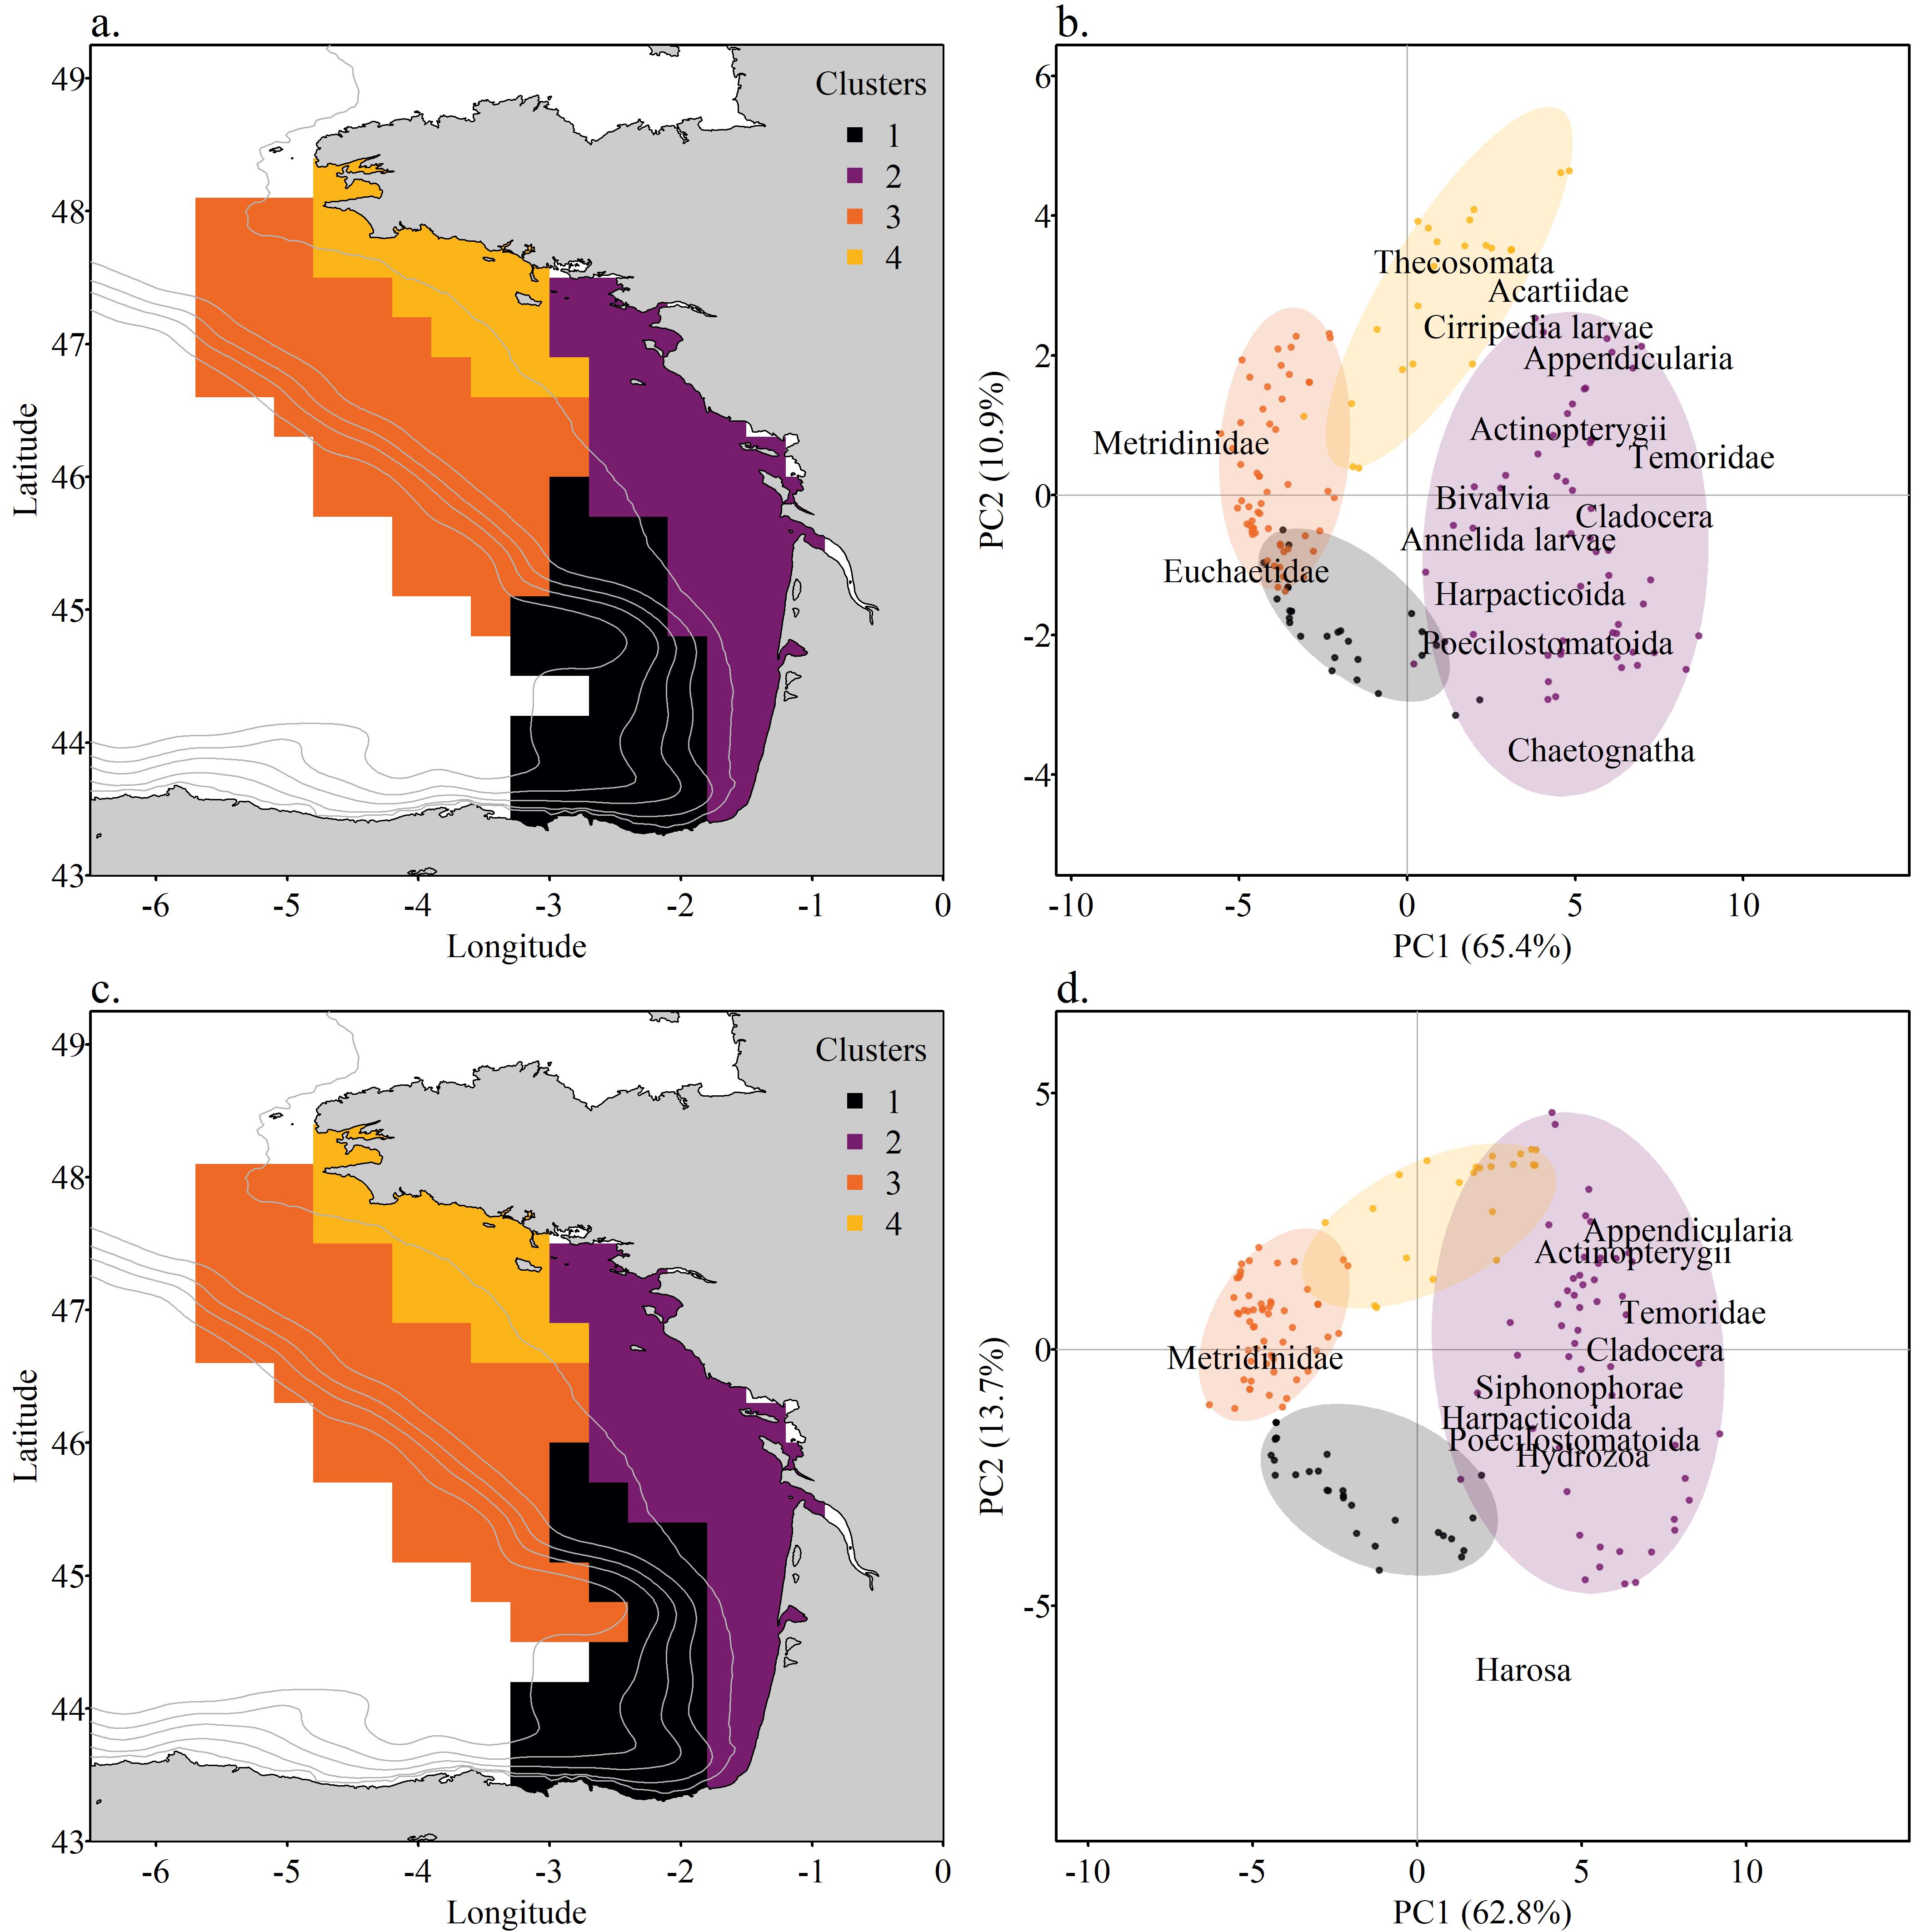
Figure S8. (a – c) Zooplankton community spatial structure derived from the hierarchical clustering of grid cells' coordinates in the biovolumes Principal Component Analyses (PCA) factorial space ...
Grandremy Nina, Dupuy Christine, Petitgas Pierre, Le Mestre Sophie, Bourriau Paul, Nowaczyk Antoine, Forest Bertrand, Romagnan Jean-Baptiste (2023). The ZooScan and the ZooCAM zooplankton imaging systems are intercomparable: A benchmark on the Bay of Biscay zooplankton. Limnology And Oceanography-methods. 21 (11). 718-733. https://doi.org/10.1002/lom3.10577, https://archimer.ifremer.fr/doc/00855/96671/